Single Point Products
What is the Data Lister tool?
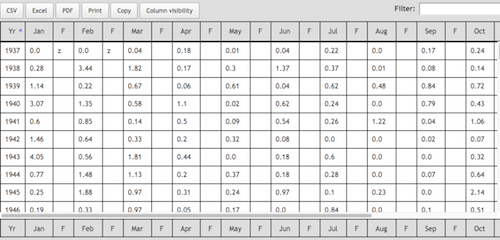
Access to historic station and grid point data
What datasets are available?
Works with historic station data as well as gridded datasets
SEE STATION_NETWORKS
SEE GRIDDED DATASETS
Source: Northeast Regional Climate Center (NRCC)
Domain: Continental US
Temporal Resolution: Daily
Date Range: 1950 - Present
Spatial Resolution: 5 km
Climate Variables: Maximum/Minimum Temperature, Precipitation, Degree Days
NRCC Interpolated High Resolution
Source: Northeast Regional Climate Center (NRCC)
Domain: East of Rockies
Date Range: 2007 - Present
Temporal Resolution: Daily
Spatial Resolution: 5 km
Climate Variables: Maximum/Minimum Temperature, Precipitation, Degree Days
PRISM
Source: PRISM Climate Group
Domain: Continental US
Temporal Resolution:
Daily
Date Range: 1981- Present
Spatial Resolution: 4 km
Climate Variables:
Maximum/Minimum/Average Temperature, Precipitation, Degree Days
Version: “4kmD1”
-------- LOCA DOWNSCALED CMIP5 PROJECTIONS --------
GDFL-CM3
Source: Geophysical Fluid Dynamics Laboratory
Domain: US, Canada, Mexico
Temporal Resolution: Daily
Date Range: 1950 - 2100
Spatial Resolution: 6 km
Climate Variables: Maximum/Minimum Temperature, Precipitation, Degree Days
Emission Scenarios: rcp45, rcp85
HadGEM2-CC
Source: Met Office Hadley Center
Domain: US, Canada, Mexico
Temporal Resolution: Daily
Date Range: 1950 - 2100
Spatial Resolution: 6 km
Climate Variables: Maximum/Minimum Temperature, Precipitation, Degree Days
Emission Scenarios: rcp45, rcp85
HadGEM2-ES
Source: Met Office Hadley Center (additional HadGEM2-ES realizations contributed by Instituto Nacional de Pesquisas Espaciais)
Domain: US, Canada, Mexico
Temporal Resolution: Daily
Date Range: 1950 - 2100
Spatial Resolution: 6 km
Climate Variables: Maximum/Minimum Temperature, Precipitation, Degree Days
Emission Scenarios: rcp45, rcp85
CCSM4
Source: The Community Climate System Model
Domain: US, Canada, Mexico
Temporal Resolution: Daily
Date Range: 1950 - 2100
Spatial Resolution: 6 km
Climate Variables: Maximum/Minimum Temperature, Precipitation, Degree Days
Emission Scenarios: rcp45, rcp85
CanESM2
Source: Canadian Centre for Climate Modelling and Analysis
Domain: US, Canada, Mexico
Temporal Resolution: Daily
Date Range: 1950 - 2100
Spatial Resolution: 6 km
Climate Variables: Maximum/Minimum Temperature, Precipitation, Degree Days
Emission Scenarios: rcp45, rcp85
CESM1-BGC
Source: The Community Earth System Model
Domain: US, Canada, Mexico
Temporal Resolution: Daily
Date Range: 1950 - 2100
Spatial Resolution: 6 km
Climate Variables: Maximum/Minimum Temperature, Precipitation, Degree Days
Emission Scenarios: rcp45, rcp85
CMCC-CMS
Source: The Centro Euro-Mediterraneo sui Cambiamenti Climatici
Domain: US, Canada, Mexico
Temporal Resolution: Daily
Date Range: 1950 - 2100
Spatial Resolution: 6 km
Climate Variables: Maximum/Minimum Temperature, Precipitation, Degree Days
Emission Scenarios: rcp45, rcp85
CNRM-CM5
Source: Centre National de Recherches Météorologiques
Domain: US, Canada, Mexico
Temporal Resolution: Daily
Date Range: 1950 - 2100
Spatial Resolution: 6 km
Climate Variables: Maximum/Minimum Temperature, Precipitation, Degree Days
Emission Scenarios: rcp45, rcp85
MICRO5
Source: Atmosphere and Ocean Research Institute, the University of Tokyo
Domain: US, Canada, Mexico
Temporal Resolution: Daily
Date Range: 1950 - 2100
Spatial Resolution: 6 km
Climate Variables: Maximum/Minimum Temperature, Precipitation, Degree Days
Emission Scenarios: rcp45, rcp85
ACCESS1-0
Source: ARC Centre of Excellence for Climate System Science
Domain: US, Canada, Mexico
Temporal Resolution: Daily
Date Range: 1950 - 2100
Spatial Resolution: 6 km
Climate Variables: Maximum/Minimum Temperature, Precipitation, Degree Days
Emission Scenarios: rcp45, rcp85
-------- NARRCAP PROJECTIONS --------
CRCM -- Canadian Regional Climate Model
Source: Ouranos Climate Simulation Team / UQAM via NARRCAP
Domain: US
Temporal Resolution: Daily
Date Range: 1970 - 2000, 2040 - 2070
Spatial Resolution: 50km
Climate Variables: Maximum/Minimum Temperature, Precipitation
HRM3 -- Hadley Regional Model
Source: Hadley Centre via NARCCAP
Domain: US
Temporal Resolution: Daily
Date Range: 1970 - 2000, 2040 - 2070
Spatial Resolution: 50km
Climate Variables: Maximum/Minimum Temperature, Precipitation
MM5I -- PSU/NCAR mesoscale model
Source: NCAR-Mesoscale Prediction Group/Penn State via NARCCAP
Domain: US
Temporal Resolution: Daily
Date Range: 1970 - 2000, 2040 - 2070
Spatial Resolution: 50km
Climate Variables: Maximum/Minimum Temperature, Precipitation
RCM3 -- Regional Climate Model Version 3
Source: UC Santa Cruz via NARCCAP
Domain: US
Temporal Resolution: Daily
Date Range: 1970 - 2000, 2040 - 2070
Spatial Resolution: 50km
Climate Variables: Maximum/Minimum Temperature, Precipitation
WRFG -- Weather Research Forecasting Model
Source: Mesoscale and Microscale Meteorology spanision of NCAR via NARCCAP
Domain: US
Temporal Resolution: Daily
Date Range: 1970 - 2000, 2040 - 2070
Spatial Resolution: 50km
Climate Variables: Maximum/Minimum Temperature, Precipitation
Temporal Resolution
Daily for station data.
Daily (NARRCAP, PRISM), monthly/yearly (PRISM)
Observed Quantities
Station/Gridded:
Precipitation (in/mm)
Maximum Temperature (F/C), Minimum Temperature (F/C)
Station only:
Observation Time Temperature (F/C)
Snowfall (in/mm), Snow Depth (in/mm)
Derived Quantities
Station/Gridded:
Heating/Cooling/Growing Degree Days (F/C)
Average Temperature (F/C)
All data sets are made available through the ACIS system.
ACIS Home Page
What can you do with this tool?
Access and download data
Available Data Formats: .xls, .dat, .txt, html(prints to screen)
What is this tool?
Calculates various monthly statistics
for a station over a range of years chosen by the user
Calculations are based on daily input data
Tables and graphs can be created for the following climate variables:
-
Maximum/Minimum/Mean Temperature, Temperature Range (station only)
Precipitation/Snowfall (station only)/Snow Depth (station only)
Heating/Cooling/Growing Degree Days
-
Monthly Maximum
Monthly Minimum
Monthly Average
Standard Deviation
Number of Days (above/below/between thresholds)
Range during Month
Monthly Sum
What datasets can be used?
Works with historic station data as well as gridded datasets
SEE STATION_NETWORKS
SEE GRIDDED DATASETS
Source: Northeast Regional Climate Center (NRCC)
Domain: Continental US
Temporal Resolution: Daily
Date Range: 1950 - Present
Spatial Resolution: 5 km
Climate Variables: Maximum/Minimum Temperature, Precipitation, Degree Days
NRCC Interpolated High Resolution
Source: Northeast Regional Climate Center (NRCC)
Domain: East of Rockies
Date Range: 2007 - Present
Temporal Resolution: Daily
Spatial Resolution: 5 km
Climate Variables: Maximum/Minimum Temperature, Precipitation, Degree Days
PRISM
Source: PRISM Climate Group
Domain: Continental US
Temporal Resolution:
Daily
Date Range: 1981- Present
Spatial Resolution: 4 km
Climate Variables:
Maximum/Minimum/Average Temperature, Precipitation, Degree Days
Version: “4kmD1”
Temporal Resolution
Daily
All data sets are made available through the ACIS system.
What can you do with this tool?
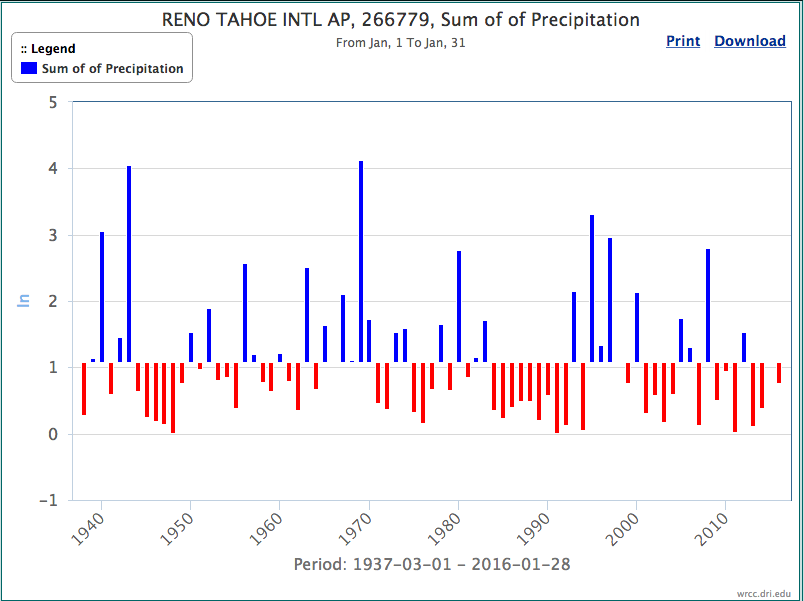
Generate summary tables
Generate time series graphs for individual months or
summarize several months in one graph
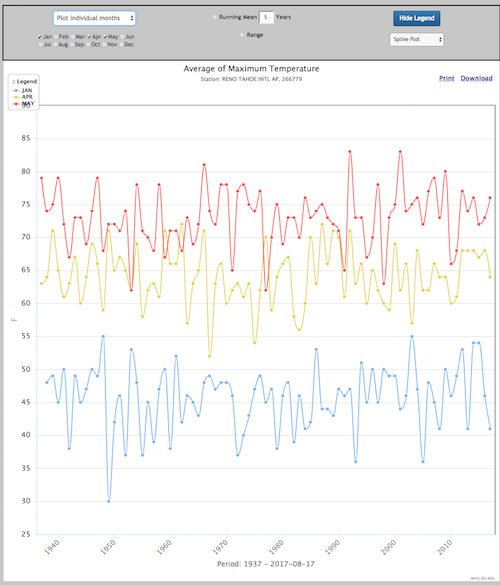
Get raw data behind the graphics
What is this tool?
For each year in the period of record for a station or a valid date range for a grid,
data is temporally summarized over a custom time period specified by Start/End Month/Day.
What datasets are available?
Works with historic station data as well as interpolated gridded datasets
SEE STATION_NETWORKS
SEE GRIDDED DATASETS
Source: Northeast Regional Climate Center (NRCC)
Domain: Continental US
Temporal Resolution: Daily
Date Range: 1950 - Present
Spatial Resolution: 5 km
Climate Variables: Maximum/Minimum Temperature, Precipitation, Degree Days
NRCC Interpolated High Resolution
Source: Northeast Regional Climate Center (NRCC)
Domain: East of Rockies
Date Range: 2007 - Present
Temporal Resolution: Daily
Spatial Resolution: 5 km
Climate Variables: Maximum/Minimum Temperature, Precipitation, Degree Days
PRISM
Source: PRISM Climate Group
Domain: Continental US
Temporal Resolution:
Daily
Date Range: 1981- Present
Spatial Resolution: 4 km
Climate Variables:
Maximum/Minimum/Average Temperature, Precipitation, Degree Days
Version: “4kmD1”
Temporal Resolution
Daily
Observed Quantities
Station/Gridded:
Precipitation (in/mm)
Maximum Temperature (F/C), Minimum Temperature (F/C)
Station only:
Observation Time Temperature (F/C)
Snowfall (in/mm), Snow Depth (in/mm)
Derived Quantities
Station/Gridded:
Heating/Cooling/Growing Degree Days (F/C)
Average Temperature (F/C)
All data sets are made available through the ACIS system.
ACIS Home Page
What can you do with this tool?
Generate Time Series, Download Data and Graphs
What this tool?
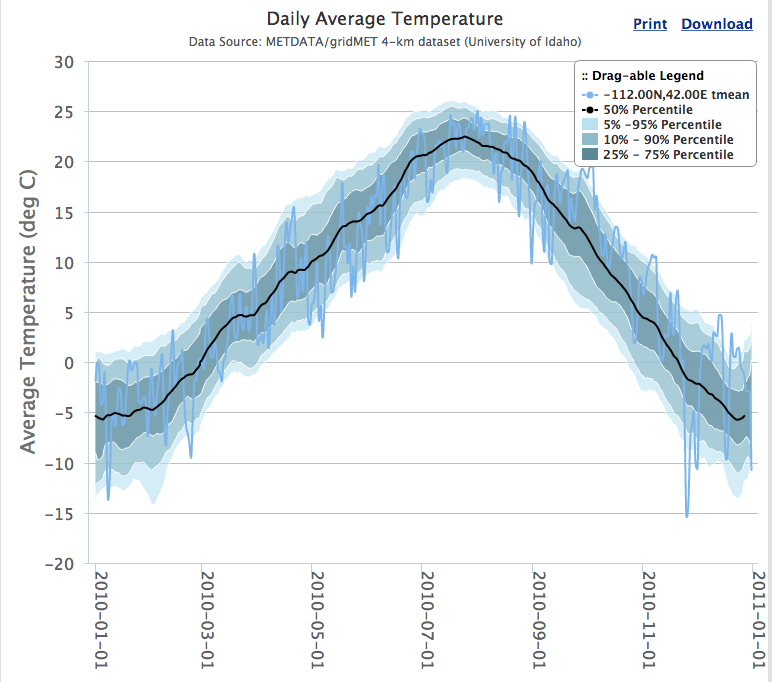
For a chosen target year time series of daily values is generated
50% (Climatology), 5%-95%, 10% - 90% and 25% - 75% Percentile ranges are also computed
What datasets are available?
Works with historic station data as well as interpolated gridded datasets
SEE STATION_NETWORKS
SEE GRIDDED DATASETS
Source: Northeast Regional Climate Center (NRCC)
Domain: Continental US
Temporal Resolution: Daily
Date Range: 1950 - Present
Spatial Resolution: 5 km
Climate Variables: Maximum/Minimum Temperature, Precipitation, Degree Days
NRCC Interpolated High Resolution
Source: Northeast Regional Climate Center (NRCC)
Domain: East of Rockies
Date Range: 2007 - Present
Temporal Resolution: Daily
Spatial Resolution: 5 km
Climate Variables: Maximum/Minimum Temperature, Precipitation, Degree Days
PRISM
Source: PRISM Climate Group
Domain: Continental US
Temporal Resolution:
Daily
Date Range: 1981- Present
Spatial Resolution: 4 km
Climate Variables:
Maximum/Minimum/Average Temperature, Precipitation, Degree Days
Version: “4kmD1”
Temporal Resolution
Daily
Observed Quantities
Station/Gridded:
Precipitation (in/mm)
Maximum Temperature (F/C), Minimum Temperature (F/C)
Station only:
Observation Time Temperature (F/C)
Snowfall (in/mm), Snow Depth (in/mm)
Derived Quantities
Station/Gridded:
Heating/Cooling/Growing Degree Days (F/C)
Average Temperature (F/C)
All data sets are made available through the ACIS system.
ACIS Home Page
What can you do with this tool?
Compare time series over one year
to period of record climatology and percentiles
What is this tool?
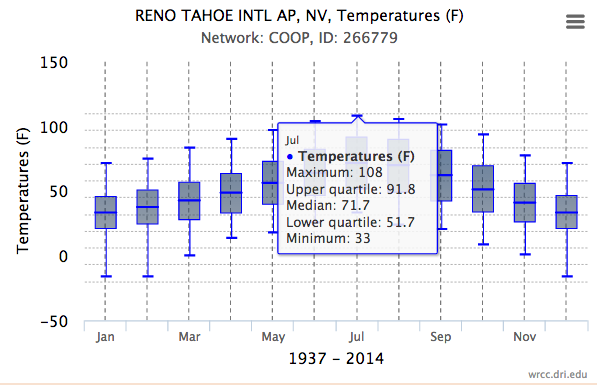
Calculates a general climatology for a station or grid point.
Based on daily input data
Creates tables and graphs of monthly and seasonal summaries
What datasets can be used?
Works with historic station data as well as gridded datasets
SEE STATION_NETWORKS
SEE GRIDDED DATASETS
Source: Northeast Regional Climate Center (NRCC)
Domain: Continental US
Temporal Resolution: Daily
Date Range: 1950 - Present
Spatial Resolution: 5 km
Climate Variables: Maximum/Minimum Temperature, Precipitation, Degree Days
NRCC Interpolated High Resolution
Source: Northeast Regional Climate Center (NRCC)
Domain: East of Rockies
Date Range: 2007 - Present
Temporal Resolution: Daily
Spatial Resolution: 5 km
Climate Variables: Maximum/Minimum Temperature, Precipitation, Degree Days
PRISM
Source: PRISM Climate Group
Domain: Continental US
Temporal Resolution:
Daily
Date Range: 1981- Present
Spatial Resolution: 4 km
Climate Variables:
Maximum/Minimum/Average Temperature, Precipitation, Degree Days
Version: “4kmD1”
Temporal Resolution
Daily
Observed Quantities
Station/Gridded:
Precipitation (in/mm)
Maximum Temperature (F/C), Minimum Temperature (F/C)
Station only:
Observation Time Temperature (F/C)
Snowfall (in/mm), Snow Depth (in/mm)
Derived Quantities
Station/Gridded:
Heating/Cooling/Growing Degree Days (F/C)
Average Temperature (F/C)
All data sets are made available through the ACIS system.
ACIS Home Page
What can you do with this tool?
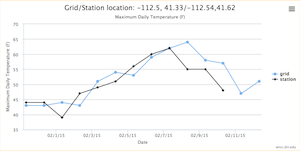
Generate summary tables

Generate summary graphs
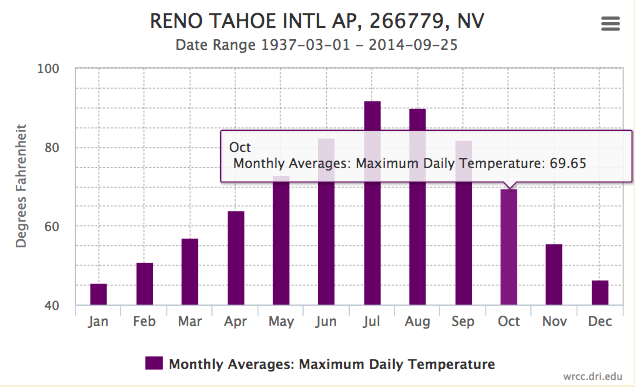
Download data tables and graphs
What is this tool?
Compares gridded data at a lon/lat coordinate with historic station data closest to the location
What datasets can be used?
SEE STATION_NETWORKS
SEE GRIDDED DATASETS
Source: Northeast Regional Climate Center (NRCC)
Domain: Continental US
Temporal Resolution: Daily
Date Range: 1950 - Present
Spatial Resolution: 5 km
Climate Variables: Maximum/Minimum Temperature, Precipitation, Degree Days
NRCC Interpolated High Resolution
Source: Northeast Regional Climate Center (NRCC)
Domain: East of Rockies
Date Range: 2007 - Present
Temporal Resolution: Daily
Spatial Resolution: 5 km
Climate Variables: Maximum/Minimum Temperature, Precipitation, Degree Days
PRISM
Source: PRISM Climate Group
Domain: Continental US
Temporal Resolution:
Daily
Date Range: 1981- Present
Spatial Resolution: 4 km
Climate Variables:
Maximum/Minimum/Average Temperature, Precipitation, Degree Days
Version: “4kmD1”
-------- LOCA DOWNSCALED CMIP5 PROJECTIONS --------
GDFL-CM3
Source: Geophysical Fluid Dynamics Laboratory
Domain: US, Canada, Mexico
Temporal Resolution: Daily
Date Range: 1950 - 2100
Spatial Resolution: 6 km
Climate Variables: Maximum/Minimum Temperature, Precipitation, Degree Days
Emission Scenarios: rcp45, rcp85
HadGEM2-CC
Source: Met Office Hadley Center
Domain: US, Canada, Mexico
Temporal Resolution: Daily
Date Range: 1950 - 2100
Spatial Resolution: 6 km
Climate Variables: Maximum/Minimum Temperature, Precipitation, Degree Days
Emission Scenarios: rcp45, rcp85
HadGEM2-ES
Source: Met Office Hadley Center (additional HadGEM2-ES realizations contributed by Instituto Nacional de Pesquisas Espaciais)
Domain: US, Canada, Mexico
Temporal Resolution: Daily
Date Range: 1950 - 2100
Spatial Resolution: 6 km
Climate Variables: Maximum/Minimum Temperature, Precipitation, Degree Days
Emission Scenarios: rcp45, rcp85
CCSM4
Source: The Community Climate System Model
Domain: US, Canada, Mexico
Temporal Resolution: Daily
Date Range: 1950 - 2100
Spatial Resolution: 6 km
Climate Variables: Maximum/Minimum Temperature, Precipitation, Degree Days
Emission Scenarios: rcp45, rcp85
CanESM2
Source: Canadian Centre for Climate Modelling and Analysis
Domain: US, Canada, Mexico
Temporal Resolution: Daily
Date Range: 1950 - 2100
Spatial Resolution: 6 km
Climate Variables: Maximum/Minimum Temperature, Precipitation, Degree Days
Emission Scenarios: rcp45, rcp85
CESM1-BGC
Source: The Community Earth System Model
Domain: US, Canada, Mexico
Temporal Resolution: Daily
Date Range: 1950 - 2100
Spatial Resolution: 6 km
Climate Variables: Maximum/Minimum Temperature, Precipitation, Degree Days
Emission Scenarios: rcp45, rcp85
CMCC-CMS
Source: The Centro Euro-Mediterraneo sui Cambiamenti Climatici
Domain: US, Canada, Mexico
Temporal Resolution: Daily
Date Range: 1950 - 2100
Spatial Resolution: 6 km
Climate Variables: Maximum/Minimum Temperature, Precipitation, Degree Days
Emission Scenarios: rcp45, rcp85
CNRM-CM5
Source: Centre National de Recherches Météorologiques
Domain: US, Canada, Mexico
Temporal Resolution: Daily
Date Range: 1950 - 2100
Spatial Resolution: 6 km
Climate Variables: Maximum/Minimum Temperature, Precipitation, Degree Days
Emission Scenarios: rcp45, rcp85
MICRO5
Source: Atmosphere and Ocean Research Institute, the University of Tokyo
Domain: US, Canada, Mexico
Temporal Resolution: Daily
Date Range: 1950 - 2100
Spatial Resolution: 6 km
Climate Variables: Maximum/Minimum Temperature, Precipitation, Degree Days
Emission Scenarios: rcp45, rcp85
ACCESS1-0
Source: ARC Centre of Excellence for Climate System Science
Domain: US, Canada, Mexico
Temporal Resolution: Daily
Date Range: 1950 - 2100
Spatial Resolution: 6 km
Climate Variables: Maximum/Minimum Temperature, Precipitation, Degree Days
Emission Scenarios: rcp45, rcp85
-------- NARRCAP PROJECTIONS --------
CRCM -- Canadian Regional Climate Model
Source: Ouranos Climate Simulation Team / UQAM via NARRCAP
Domain: US
Temporal Resolution: Daily
Date Range: 1970 - 2000, 2040 - 2070
Spatial Resolution: 50km
Climate Variables: Maximum/Minimum Temperature, Precipitation
HRM3 -- Hadley Regional Model
Source: Hadley Centre via NARCCAP
Domain: US
Temporal Resolution: Daily
Date Range: 1970 - 2000, 2040 - 2070
Spatial Resolution: 50km
Climate Variables: Maximum/Minimum Temperature, Precipitation
MM5I -- PSU/NCAR mesoscale model
Source: NCAR-Mesoscale Prediction Group/Penn State via NARCCAP
Domain: US
Temporal Resolution: Daily
Date Range: 1970 - 2000, 2040 - 2070
Spatial Resolution: 50km
Climate Variables: Maximum/Minimum Temperature, Precipitation
RCM3 -- Regional Climate Model Version 3
Source: UC Santa Cruz via NARCCAP
Domain: US
Temporal Resolution: Daily
Date Range: 1970 - 2000, 2040 - 2070
Spatial Resolution: 50km
Climate Variables: Maximum/Minimum Temperature, Precipitation
WRFG -- Weather Research Forecasting Model
Source: Mesoscale and Microscale Meteorology spanision of NCAR via NARCCAP
Domain: US
Temporal Resolution: Daily
Date Range: 1970 - 2000, 2040 - 2070
Spatial Resolution: 50km
Climate Variables: Maximum/Minimum Temperature, Precipitation
Temporal Resolution
Daily
Observed Quantities
Precipitation (in/mm)
Maximum Temperature (F/C), Minimum Temperature (F/C)
Derived Quantities
Heating/Cooling/Growing Degree Days (F/C)
Average Temperature (F/C)
All data sets are made available through the ACIS system.
ACIS Home Page
What can you do with this tool?
Generate comparative time series
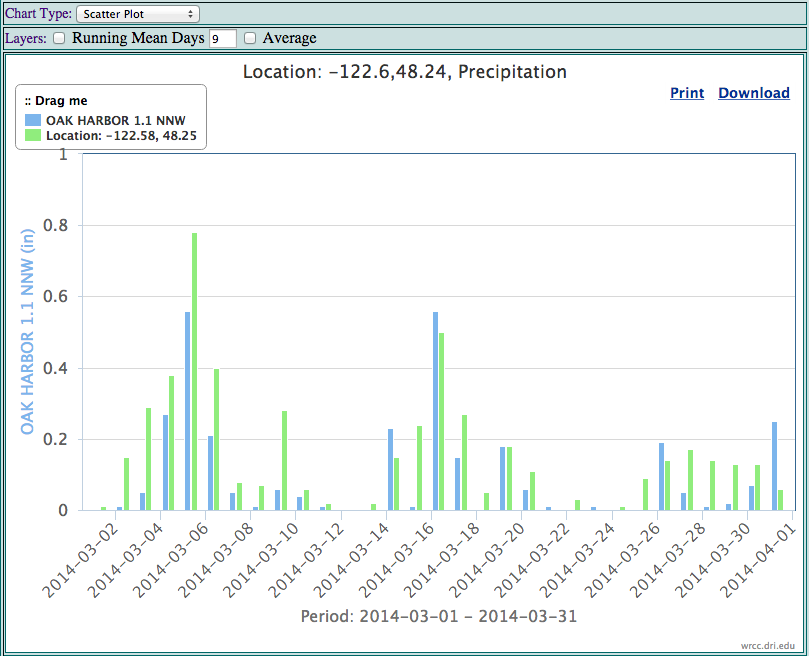
Generate comparative statistics
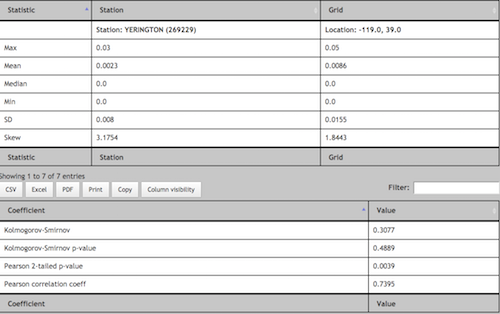
Download data tables and graphs
Not yet done.

But coming soon to a screen near you!

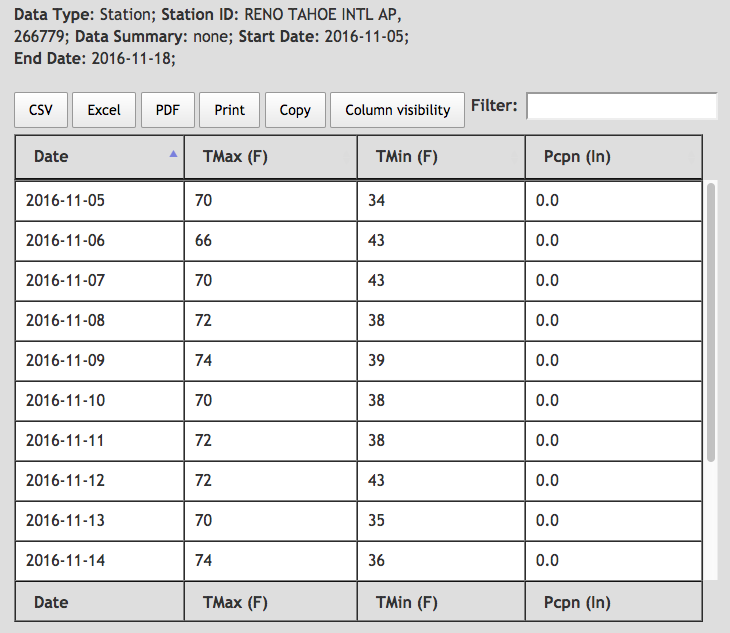
Data Lister

- Get a listing of station data for a single station or grid point
- Download as .txt, .dat, .xls
Monthly Summary

- Obtain monthly means and extremes for an individual station or grid point
- Generate customized time series from results

Single-Year

- Generate time series for a period spanning one year
- Climatology and percentiles are also computed
Climatology

- Obtain a climatology for an individual station or grid point
- Visualize results as bar charts
