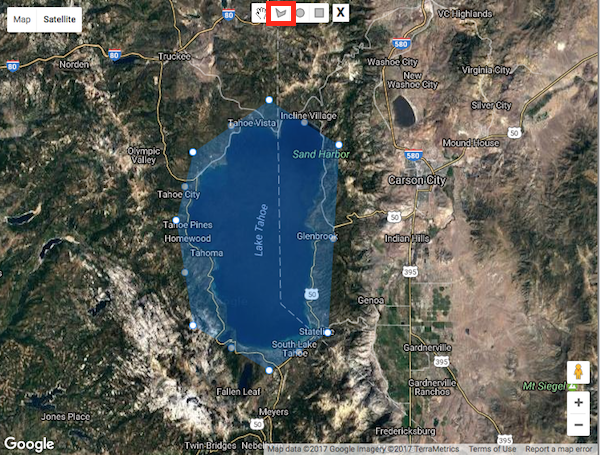
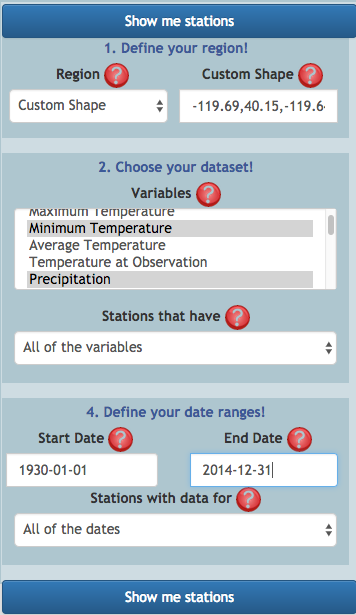
Example
Obtain all available temperature data for all stations in Washoe County, Nevada from 1990 to the present.
Step by Step instructions
- Go to
Multi-Point Products/Data Lister
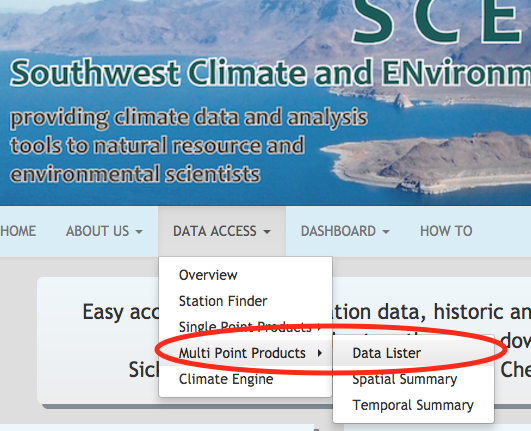
- Set the form parameters:
In the form on the left under "Area of Interest", choose "County".
A map will appear with the counties of Nevada outlined in blue.
You can click on counties on the map until you find Washoe or you can type "Washoe"
in the "County" field in the form on the left of the page and use the autofill feature.
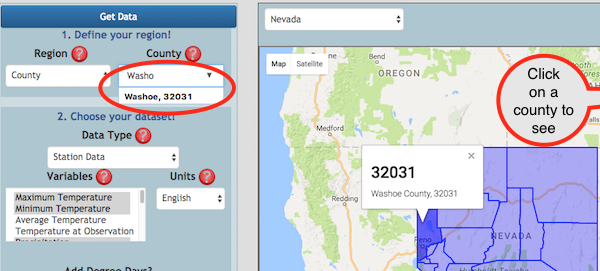
For "Data Type", choose "Station Data".
From the "Variables" drop down menu, select "Maximum Temperature", "Minimum Temperature",
"Average Temperature" and "Observation Time Temperature".
To select multiple variables:
MAC: hold down the command (apple) button while selecting the variables.
PC: hold down the control (ctrl) button while selecting the variables.
We want to list the data without summarizing. Under "Data Summary", choose "None, just get raw data".
For "Start Date", enter 1990-01-01.
For "End Date", use the default (yesterday's date; there is a lag time of on day in the database).
The completed form looks like this
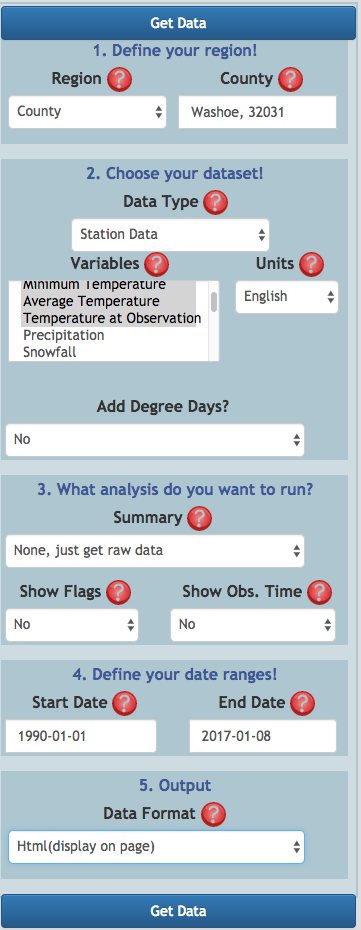
- Submit the request by clicking "Get Data".
Another form will appear asking you to choose your output formats
and to provide your name and email address.
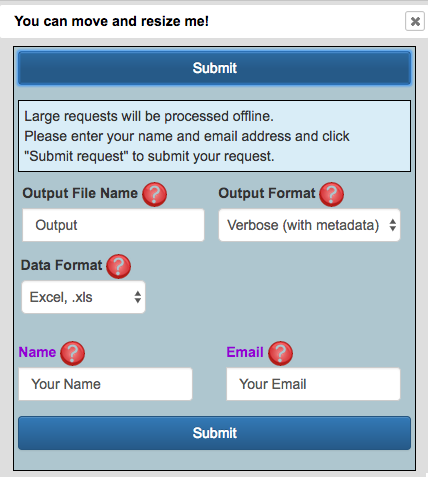
You will be notified that non-summarized data is processed offline.
You should receive an email containing a link to your data and instructions on how to download the data.
Please contact scenic@dri.edu if you do not hear from us within 12 hours.
Example
Find the highest temperature ever recorded in March at Winnemucca airport, NV.
Step by Step instructions
- Go to
Single-Point Products/Monthly Summary
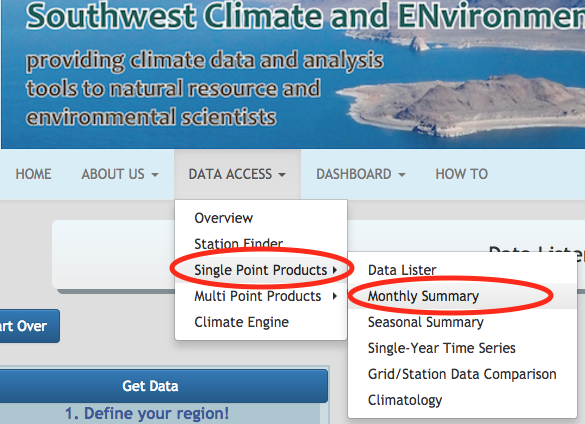
- Set the form parameters:
In the form on the left under "Point of Interest", choose "Station".
In the "Station ID" field, start typing "Winnemucca".
Choose "WINNEMUCCA MUNI AP, 269171" from the dropdown menu.
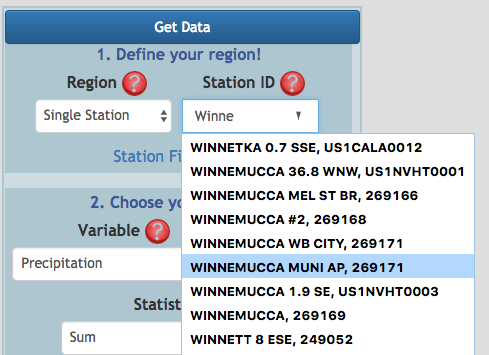
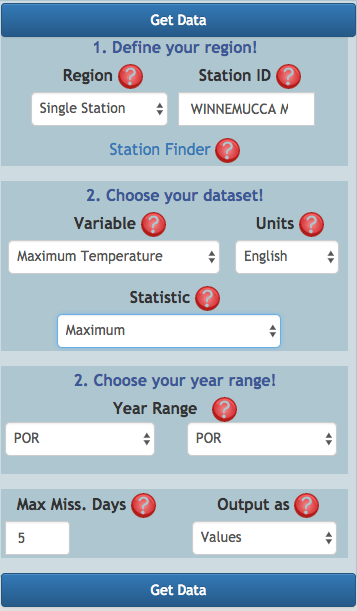
From the "Variable" drop down menu, select "Maximum Temperature".
For "Units", select "English".
For "Statistic", choose "Maximum" because we want to find the highest
of the maximum temperatures of the month.
For "Start Year" and "End Year", type "POR" (Period of Record).
For "Max Missing Days", type "0".
(Months with more than 0 of missing days will not be included in summary statistics)
For "Output as", choose "Values".
This will just list the values rather than compute departures from average conditions.
The completed form looks like this
- Submit the request by clicking "Generate Time Series".
- Interpreting the results.
For each year in the period of record of the station,
the data table shows the maximum of the maximum daily temperatures
for each month of the year. The last colum shows the maximum annual temperatures.
There are three ways to find the highest March temperature ever recorded:
- You can plot March values and look at the graph.

- You can look at the summary statistics table.
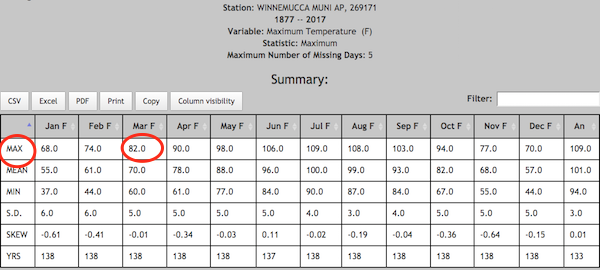
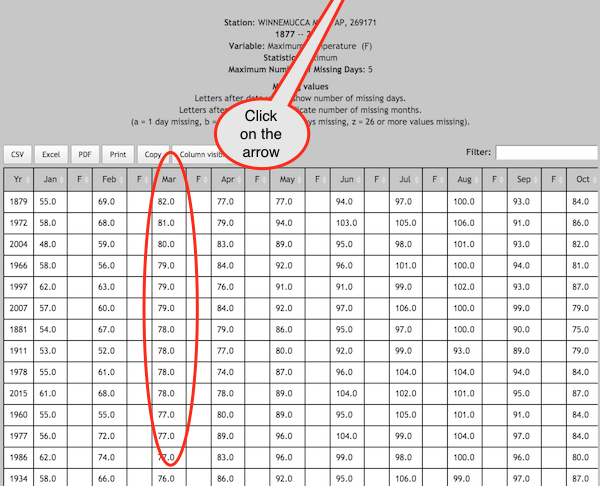
- You can sort the March column of the data table in ascending order.
What is LOCA (Localized Constructed Analogs)?
Statistically downscaled CMIP5 climate projections for North America.
Read more about LOCA...
Read more about CMIP5...
Read more about LOCA...
A word of warning
Climate projections, including downscales, are affected by
multiple forms of uncertainty, such as uncertainties in climate
forcings, uncertainties in how accurately the model
represents the true climate system, natural variability in climate and others.
Projections of future climate are not predictions or forecasts!
Climate projections present ranges of possible
future values of climate variables given certain assumptions.
Therefore, great care must be taken when using these datasets.
We have started a special LOCA page on SCENIC that will help you understand projections like LOCA
and how to use/not use them.
Read more about Projections and LOCA
Example
Aim:
To investigate climate extremes relative to the thermal or hydrologic tolerances of individual species that are
targets of management.
Resource management application:
Identifying where on a landscape temperature extremes are exceeded now and
where they may be exceeded in the future
could help prioritize where to manage for different species.
Description:
One such species is the California Spotted Owl.
It is known that at temperatures above 35.2°C,
the resting metabolic rate of adult California Spotted Owls increases substantially
and behavioral responses to heat stress are observed.
Methods:
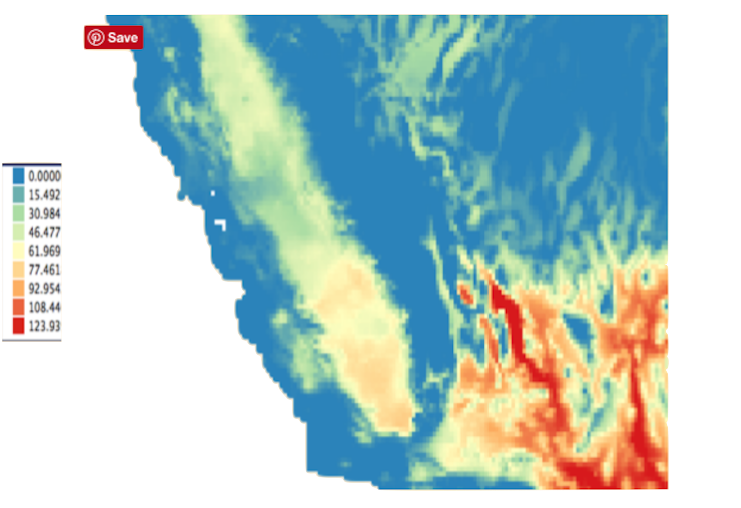
For each of the ten LOCA models we computed the total number of days per season
(May - September, inclusive) where the daily maximum temperature exceeds 35.2 Degree Celsius.
We then took the median value of the ten model results at each LOCA grid-point in California.
Figure 1: Number of days in the season (May to September 2025) where
the daily maximum temperatures exceeed 35.2 Degrees Celsius.


