Monitoring


The Southwest

The Rest

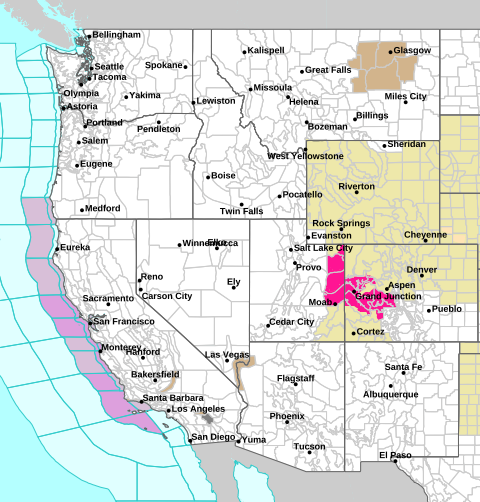
Current Weather


National Weather Service

NWS

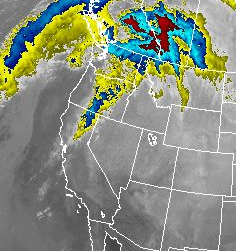
Infrared Satellite Image

InfraRed

Radar Mosaic

Radar

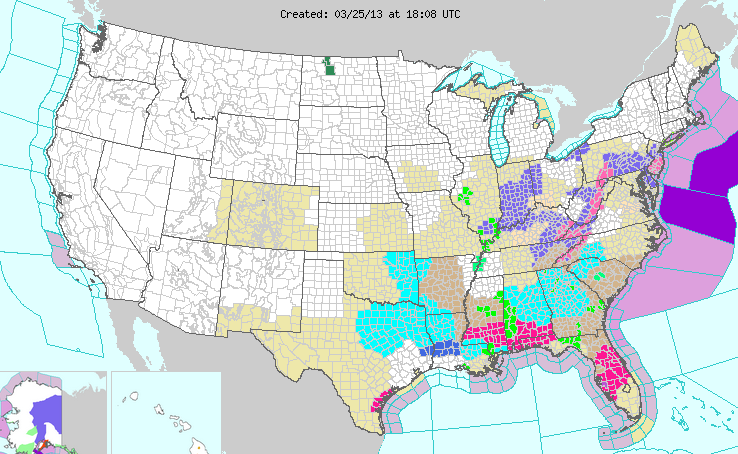
National Weather Service

NWS

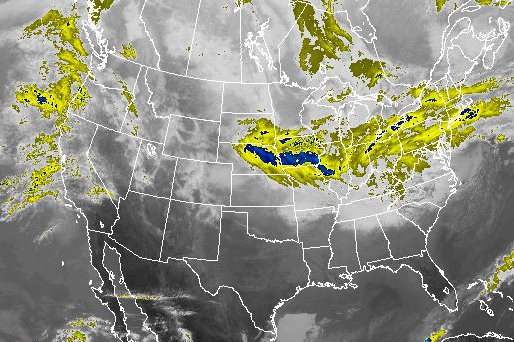
Infrared Satellite Image

Sat

Radar Mosaic

Radar

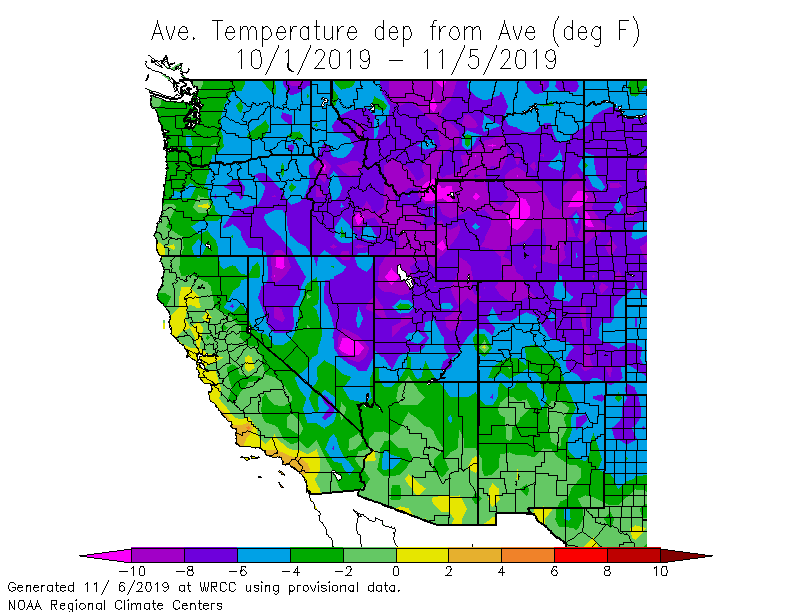
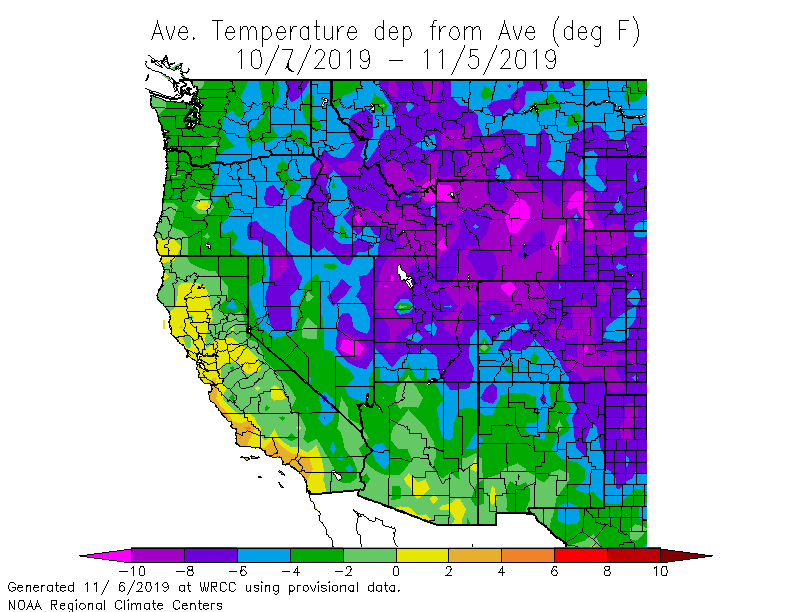
Temperature Anomaly Maps


Water Year

WaterTemp

30-day

30dTemp

7-day

7dTemp

Water Year

WaterTempUs

30-day

30dTempUS

7-day

7dTempUS

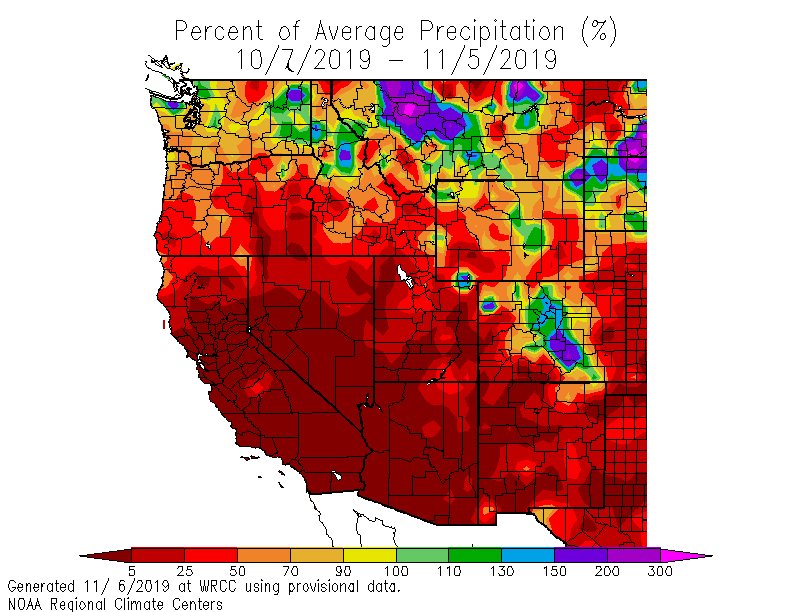
Percent of Normal Precipitation


Water Year

WaterP

30-day

30dP

7-day

7dP

Water Year

WaterPUS

30-day

30dPUS

30-day

7dPUS

Drought Information


Water Year SPI

WaterSPI

30-day SPI

30dSPI

7-day SPI

60dSPI

Water Year SPI

WaterSPIUS

30-day SPI

30dSPIUS

7-day SPI

60dSPIUS

Water Conditions


CA/NV River Forecast

CNRFC

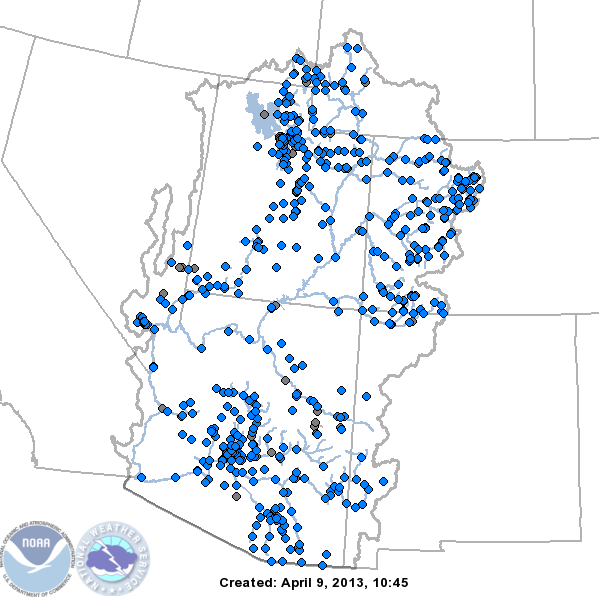
CO Basin River Forecast

CBRFC

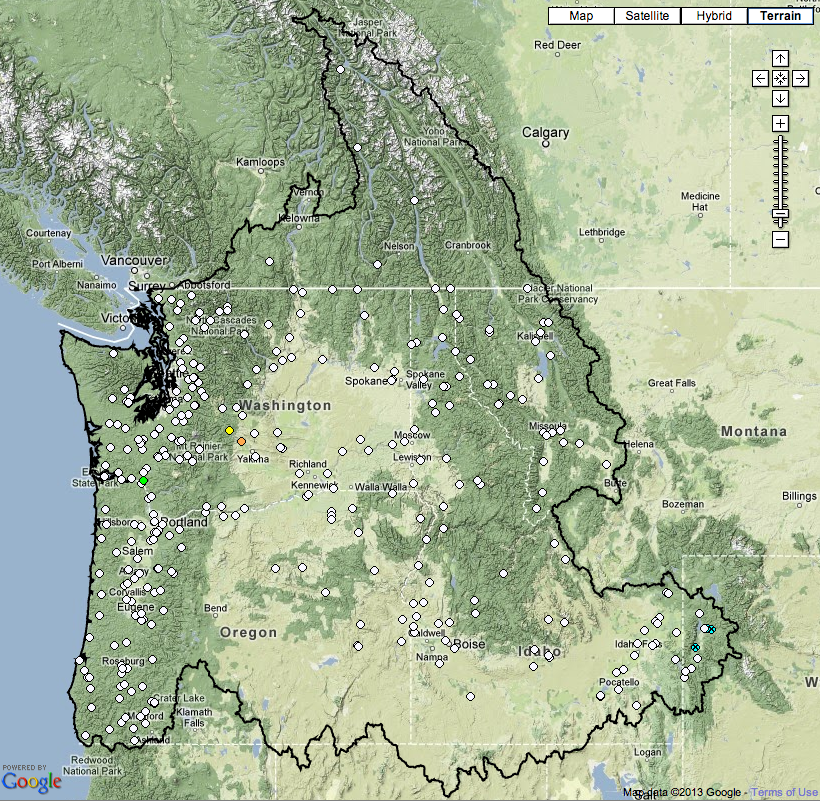
NW Pacific Forecast

PNWRFC

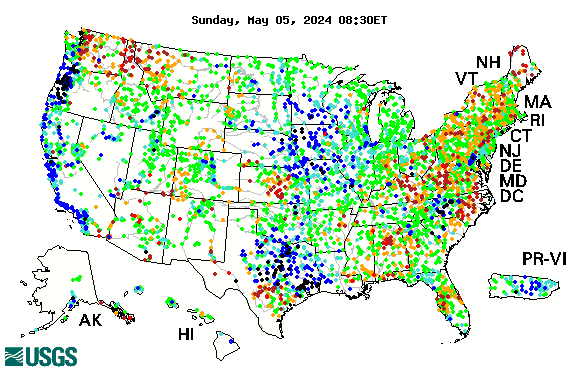
Real time comparative streamflow

RTStreamFlow

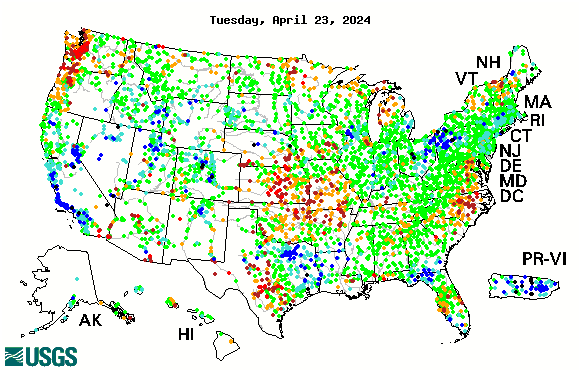
7-Day comparative streamflow

CompStreamFlow

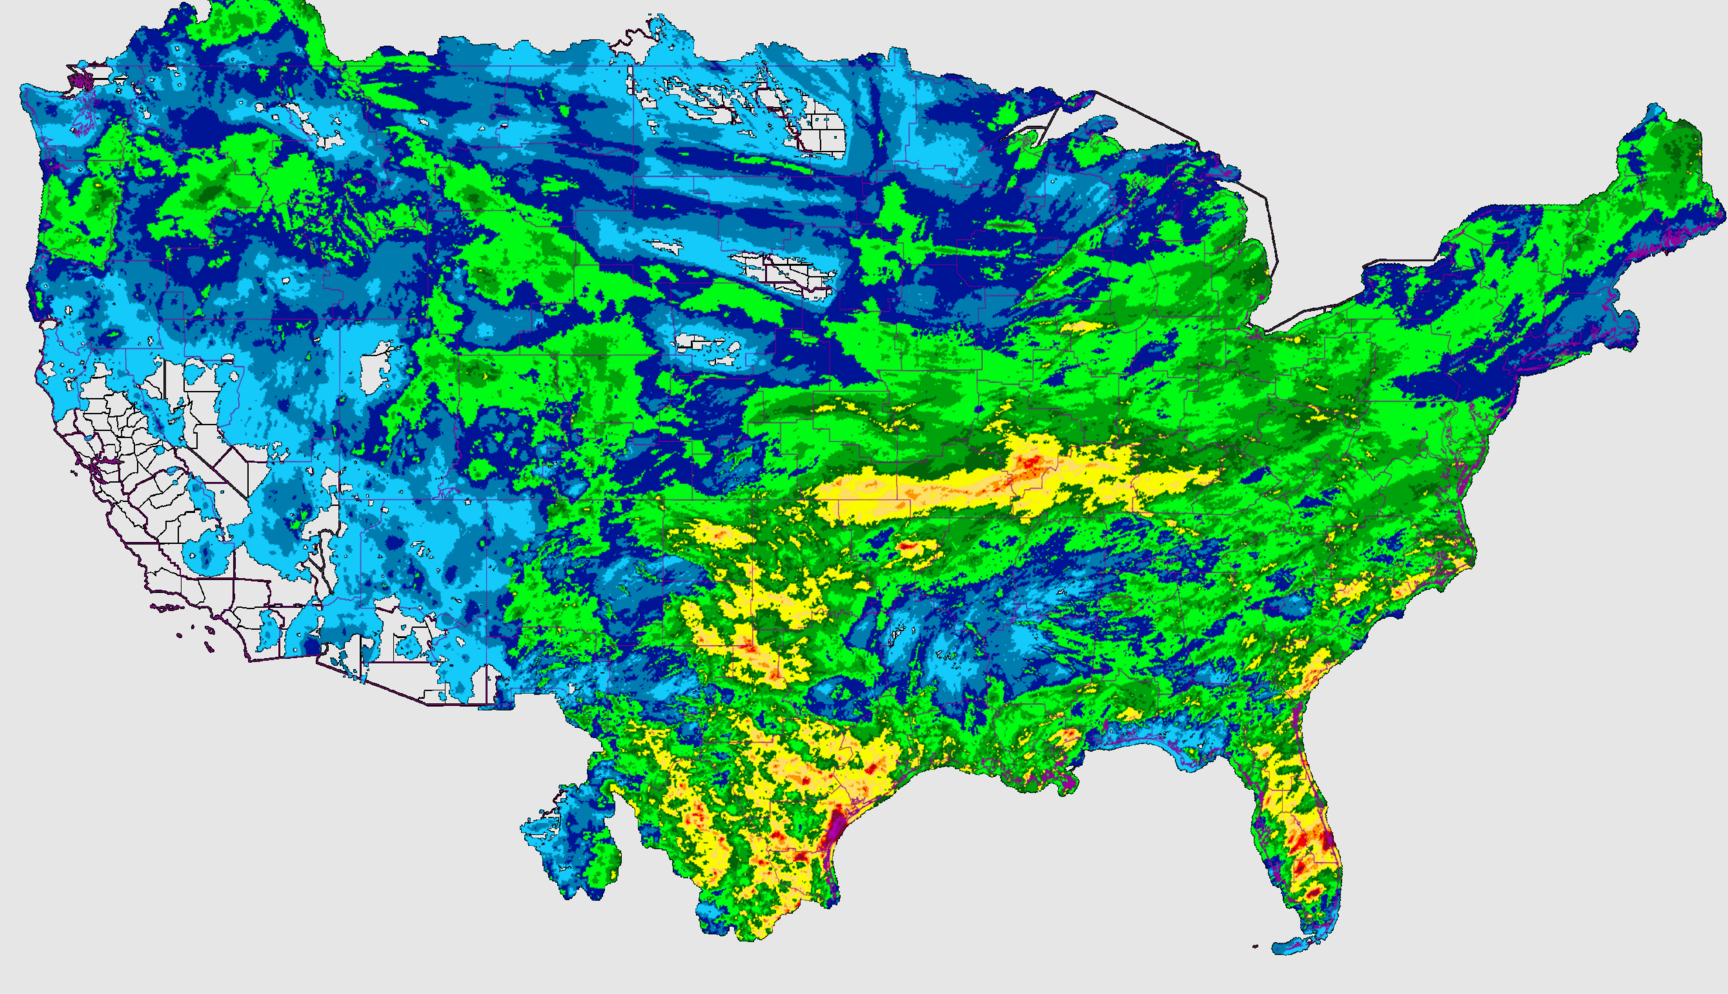
US Precipitation

USPrecip

Snow


Water Year Precipitation % of Normal

WaterSnotel

Snow Water Equivalent

PSnotel

Water Year %Snowpack

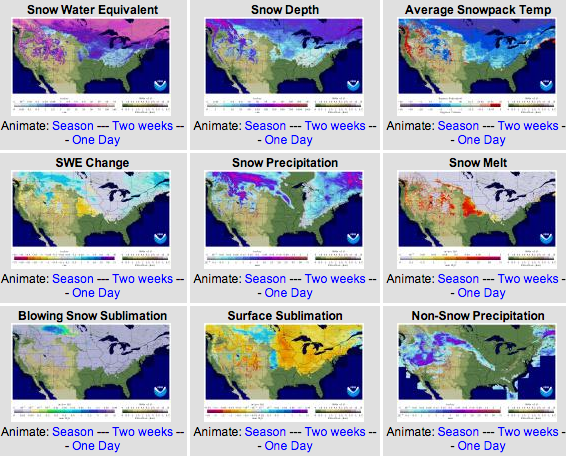
Snow

National Snow Analysis

NatSnow

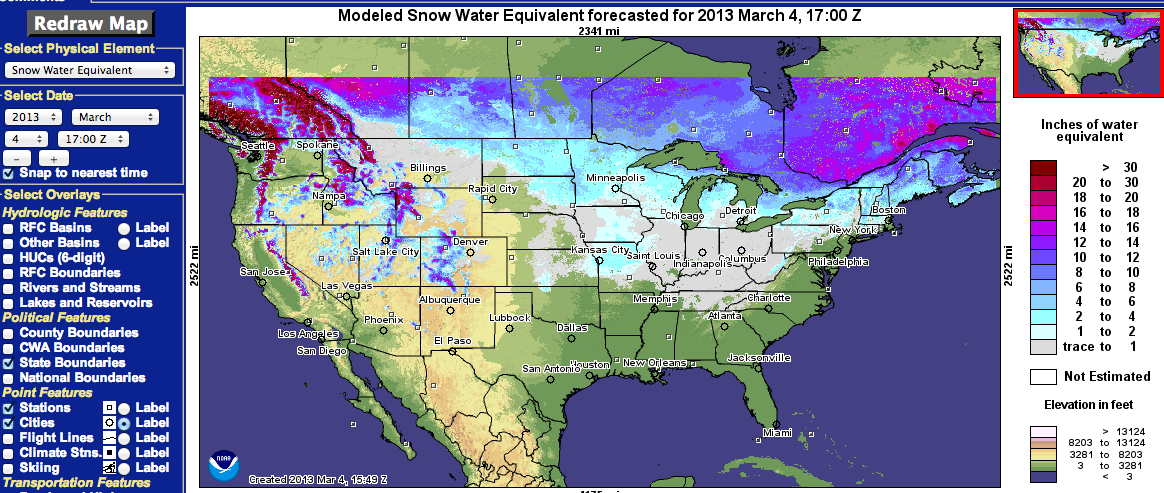
Interactive Snow Maps

SnowAnalysis

Forecasts

Snow Forecast

ENSO, AO/NAO, MJO Updates


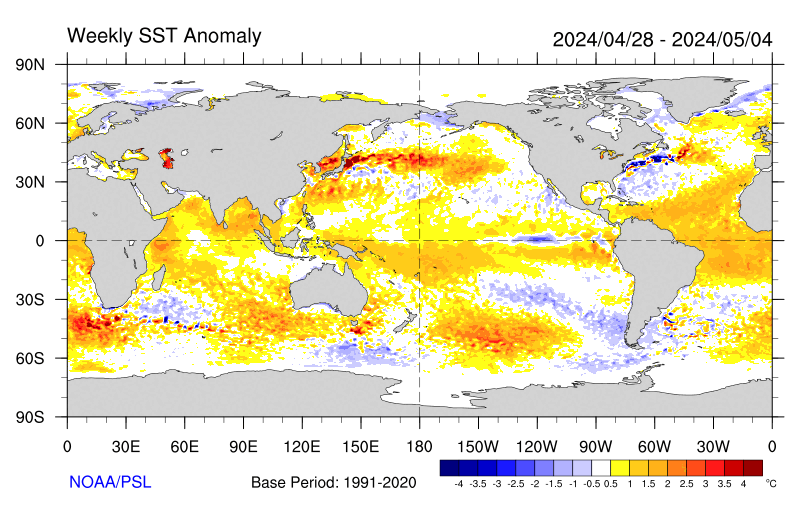
Global SST Anomaly

SST

Pacific SST Anomaly

SSTAnom

365-day ENSO SST Anomalies

ENSO

MEI ENSO Index

MEI

Daily MJO Index

MJO

Esemble forecast

AO

Projections

NWS 1-2 Week, Monthly, Seasonal Outlooks


Week1 Precip

1WP

Week2 Precip

2WP

Week 1 Temps

1WT

Week 2 temps

2WT

Experimental Projections

National Multi-Model Ensemble Experimental Forecasts (NMME)


Next Month Precip Rate

NextMonth

Next Month Temp Departures

PRate

Next Season Precip Rate

NextMonth

Next Season Temp Departures

TDept

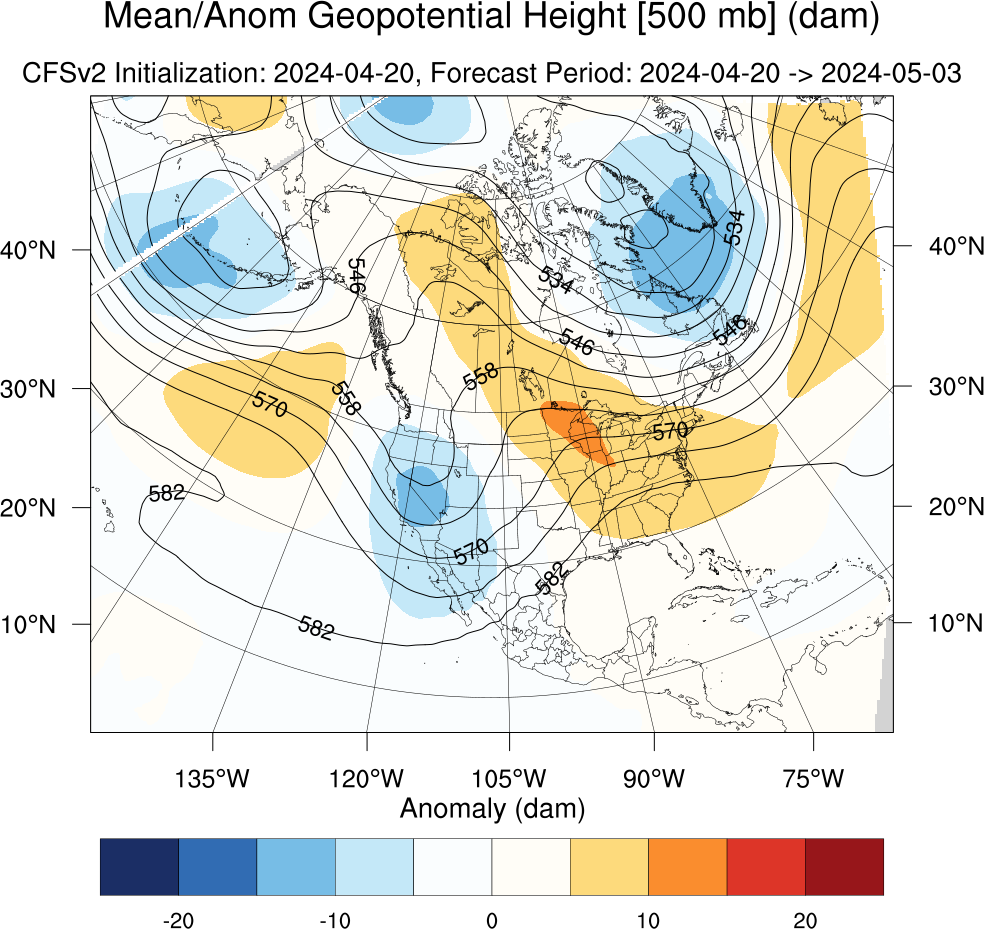
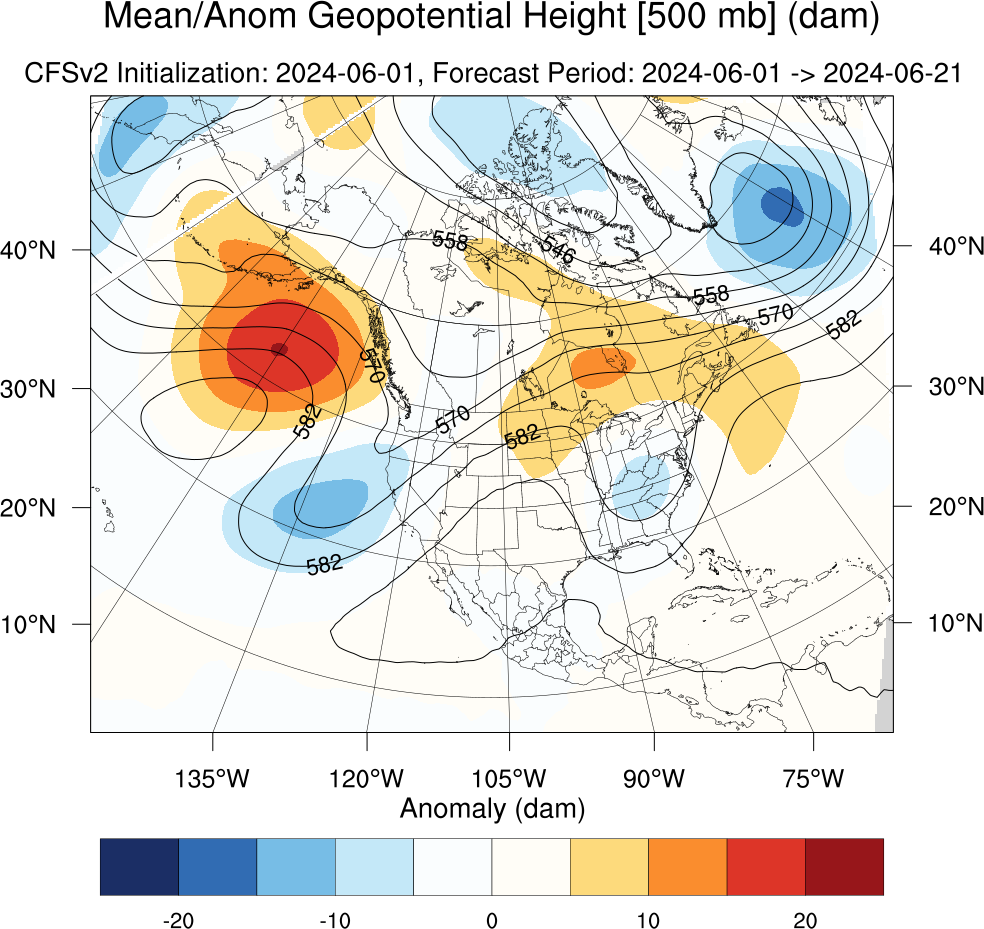
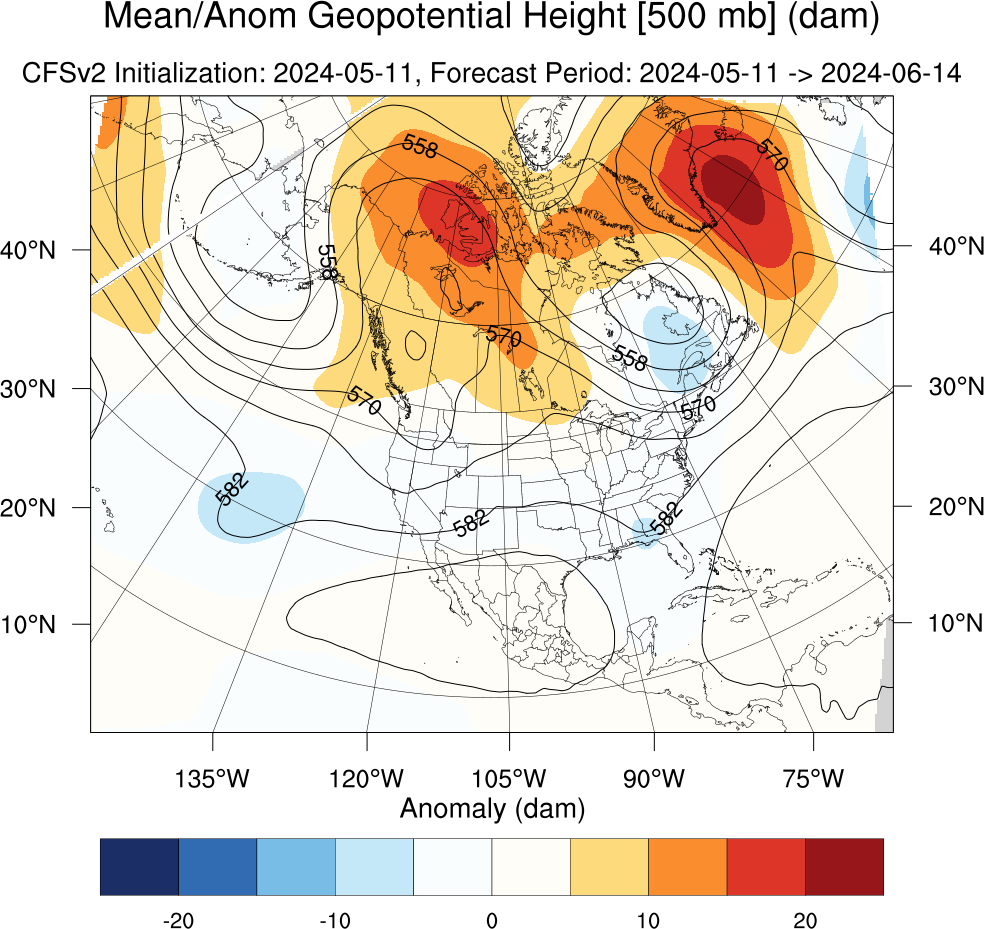
Climate Forecast System Weekly Experimental from CEFA/DRI

Mean/Anom Geopotential Height [500 mb] (dam)


Week 1

Week1

Week 2

Week2

Week 3

Week3

Week 4

Week4

Week 5

Week5