Climatology
What is this tool?
Calculates a general climatology for a station or grid point.
Based on daily input data
Creates tables and graphs of monthly and seasonal summaries
What datasets can be used?
Works with historic station data as well as gridded datasets
SEE STATION_NETWORKS
SEE GRIDDED DATASETS
Source: Northeast Regional Climate Center (NRCC)
Domain: Continental US
Temporal Resolution: Daily
Date Range: 1950 - Present
Spatial Resolution: 5 km
Climate Variables: Maximum/Minimum Temperature, Precipitation, Degree Days
NRCC Interpolated High Resolution
Source: Northeast Regional Climate Center (NRCC)
Domain: East of Rockies
Date Range: 2007 - Present
Temporal Resolution: Daily
Spatial Resolution: 5 km
Climate Variables: Maximum/Minimum Temperature, Precipitation, Degree Days
PRISM
Source: PRISM Climate Group
Domain: Continental US
Temporal Resolution:
Daily
Date Range: 1981- Present
Spatial Resolution: 4 km
Climate Variables:
Maximum/Minimum/Average Temperature, Precipitation, Degree Days
Version: “4kmD1”
Temporal Resolution
Daily
Observed Quantities
Station/Gridded:
Precipitation (in/mm)
Maximum Temperature (F/C), Minimum Temperature (F/C)
Station only:
Observation Time Temperature (F/C)
Snowfall (in/mm), Snow Depth (in/mm)
Derived Quantities
Station/Gridded:
Heating/Cooling/Growing Degree Days (F/C)
Average Temperature (F/C)
All data sets are made available through the ACIS system.
ACIS Home Page
What can you do with this tool?
Generate summary tables

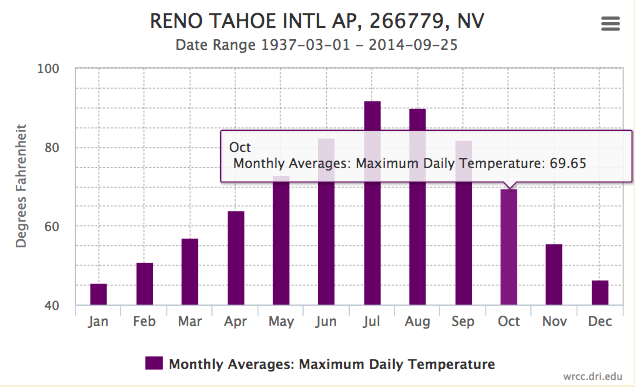
Generate summary graphs

Download data tables and graphs
- Station: Search for a single station.
You can enter a station name or ID.
Use the Station Finder to find a station name or ID. - Gridpoint: Search for a single grid point.
Enter a Lon,Lat coordinate or
Use the map interface by dragging the marker to find your location.
SEE GRIDDED DATASETS
Source: Northeast Regional Climate Center (NRCC)
Domain: Continental US
Temporal Resolution: Daily
Date Range: 1950 - Present
Spatial Resolution: 5 km
Climate Variables: Maximum/Minimum Temperature, Precipitation, Degree Days
NRCC Interpolated High Resolution
Source: Northeast Regional Climate Center (NRCC)
Domain: East of Rockies
Date Range: 2007 - Present
Temporal Resolution: Daily
Spatial Resolution: 5 km
Climate Variables: Maximum/Minimum Temperature, Precipitation, Degree Days
PRISM
Source: PRISM Climate Group
Domain: Continental US
Temporal Resolution:
Daily
Date Range: 1981- Present
Spatial Resolution: 4 km
Climate Variables:
Maximum/Minimum/Average Temperature, Precipitation, Degree Days
Version: “4kmD1”
Start and end year of the request. Format yyyy.
- All of those below
Temperature, Precipitation, Snow and Degree Day statistics. - Temperature
Max/Min/mean Temperatures for each month as well as dates when lowest/highest values occurred.
The last for columns list the number of days of exceedance of the most common thresholds:
Max Temp >=90F, <=32F, Min Temp <=32F, <=0F - Precip/Snowfall
Mean, Highs and Lows, Mean Extremes and
Number of days exceeding 0.01In, 0.10In, 0.50In, 1.0In. - Temp/Precip/Snow
Temperature Statistics as above as well as Mean and Highs for Precipitation and Snowfall. - Degree Days
- Heating Degree Days Base Temperatures: 65F, 60F, 57F, 55F, 50F
- Cooling Degree Days Base Temperatures: 55F, 57F, 60F, 65F, 70F
- Growing Degree Days
- Growing Degree Days Base Temperatures: 40F, 45F, 50F, 55F, 60F
- Corn Degree Days Base Temperatures: 50F
Data can be obtained in metric or English units.
-
Note: degree day calculations are preformed
- English:
Temperatures in Fahrenheit
Precipitation/Snow/Pan Evaporation in Inches
Wind Movements in Miles
-
Metric:
Note: native database units are English.
If you choose metric, be aware that data values loose precision
since they are converted from English units and will be rounded.
Temperatures in Celsius
Precipitation/Snow/Pan Evaporation in Millimiter
Degree Days: °C HDD = (5/9) x (°F HDD)
Wind Movements in Kilometers
with base temperatures in Fahrenheit.
Months with more than this number of days missing will be omitted from the analysis.
On the Graph
Hover your mouse over a point on the graph to see the date and data value at that point
In the top right corner of the graph you can find print and serevral download options (PNG, JPEG, PDF, SVG).


