LOCA projections
What is LOCA (Localized Constructed Analogs)?
Statistically downscaled CMIP5 climate projections for North America.
LOCA Home Page Read more about CMIP5...Where can I find scientific papers about LOCA?
LOCA peer-reviewed literature
Aim:
To investigate climate extremes relative to the thermal or hydrologic tolerances of individual species that are
targets of management.
Resource management application:
Identifying where on a landscape temperature extremes are exceeded now and
where they may be exceeded in the future
could help prioritize where to manage for different species.
Description:
One such species is the California Spotted Owl.
It is known that at temperatures above 35.2°C,
the resting metabolic rate of adult California Spotted Owls increases substantially
and behavioral responses to heat stress are observed.
Methods:
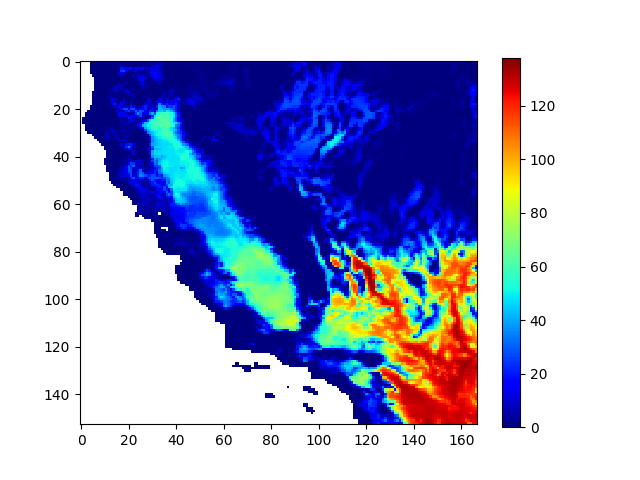
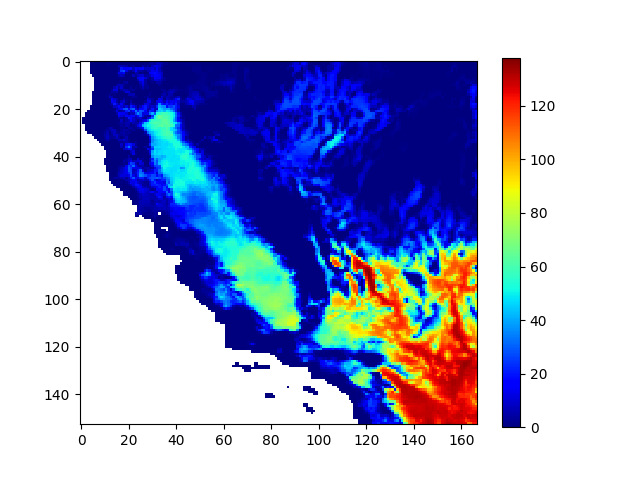
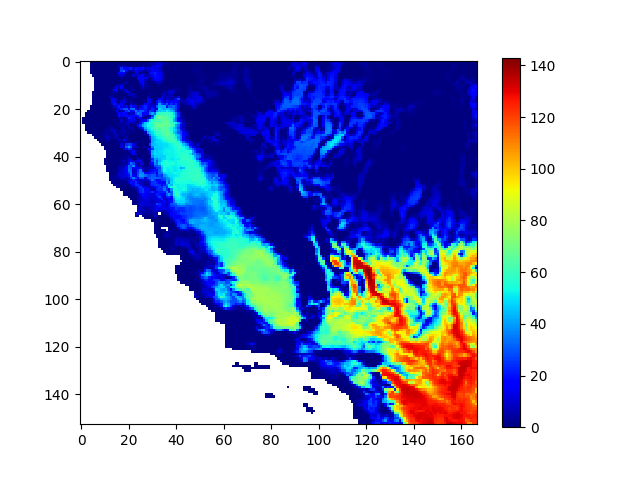
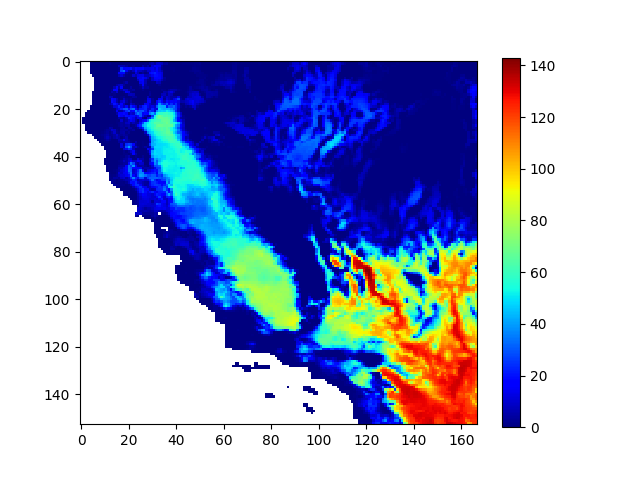
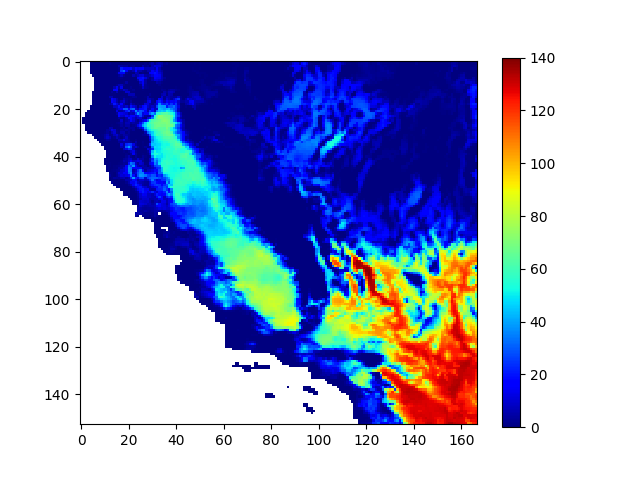
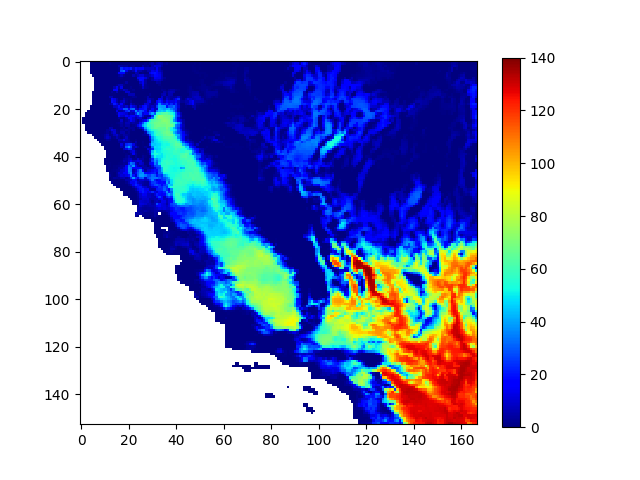
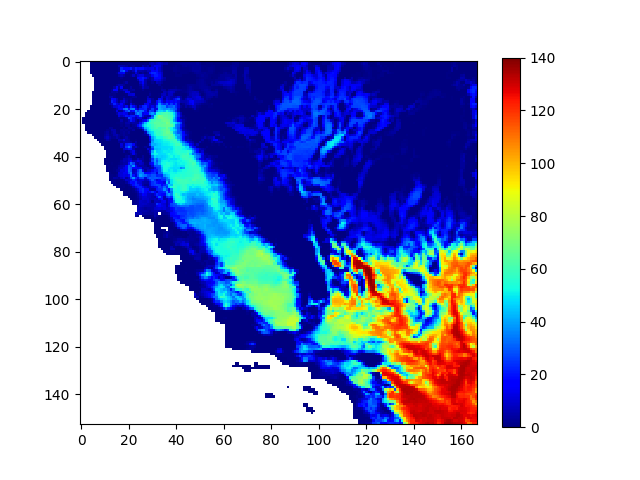
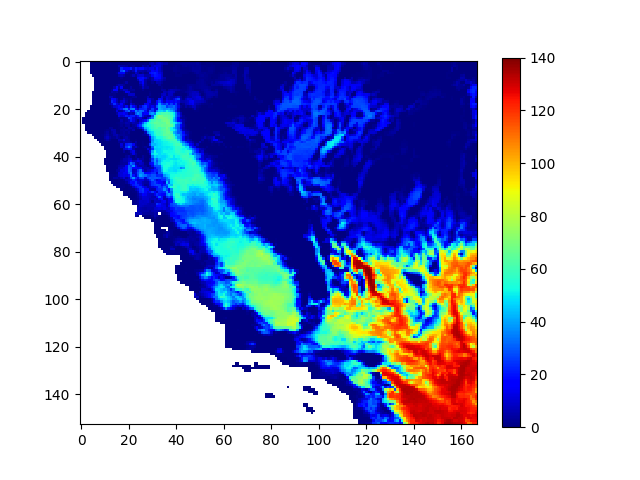
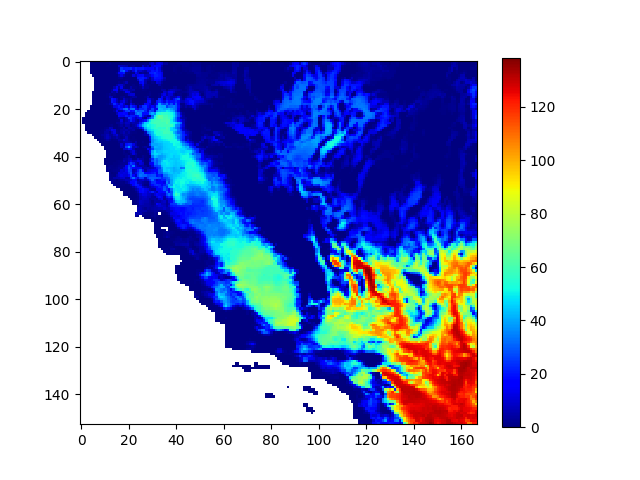
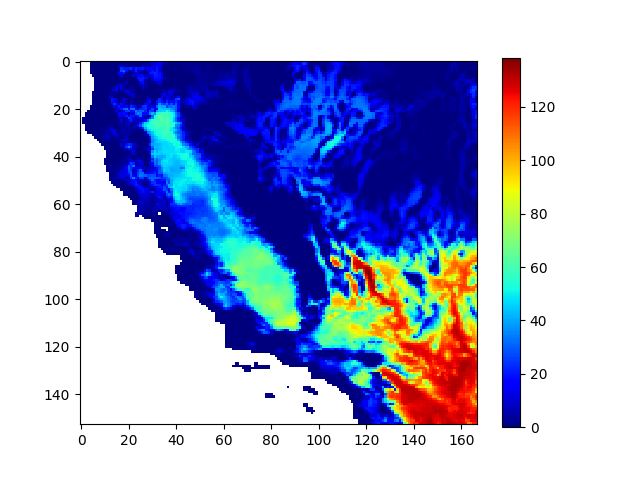
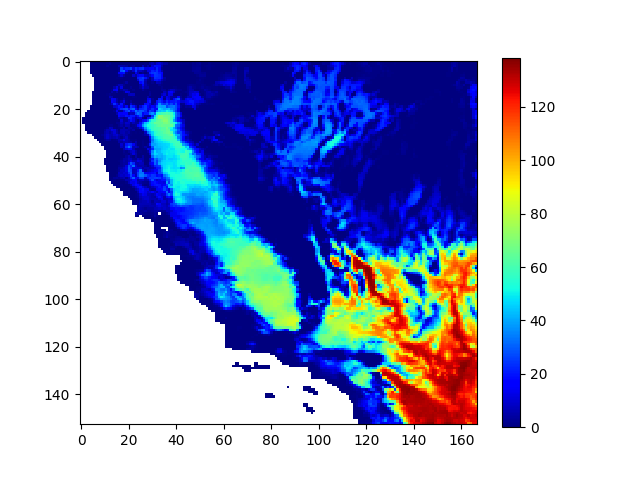
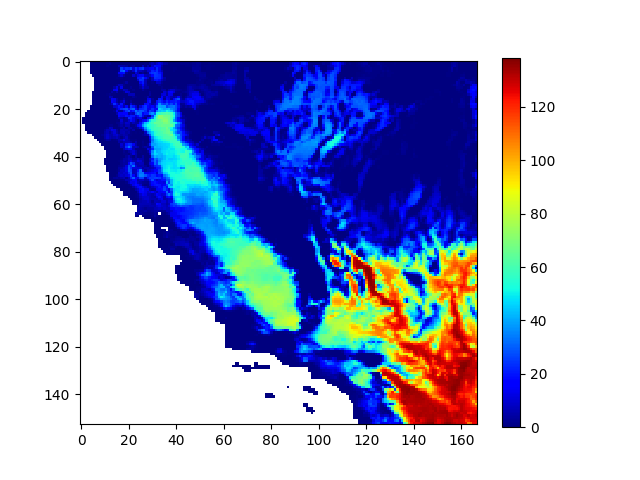
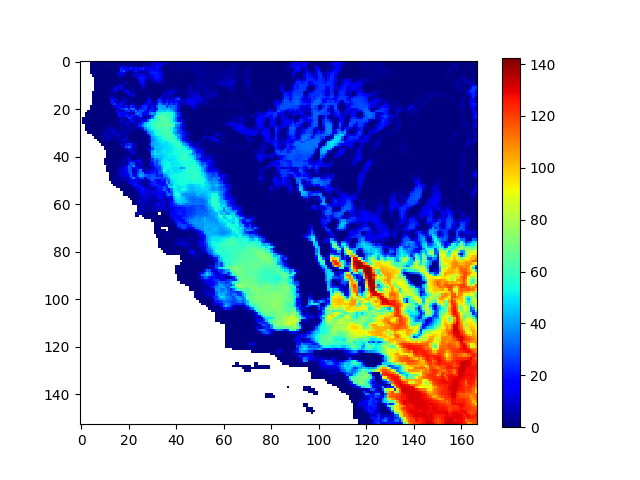
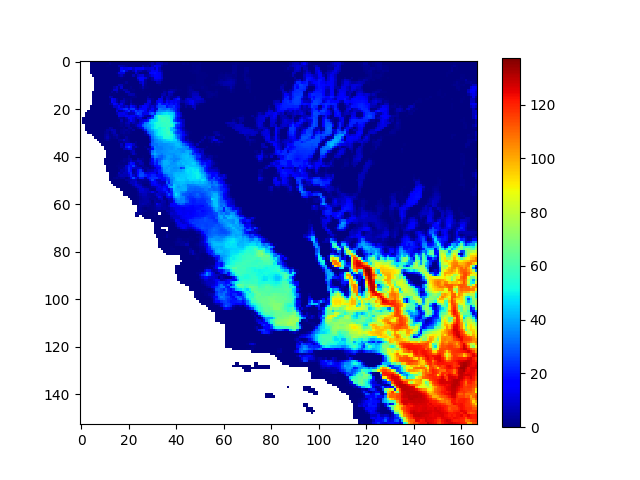
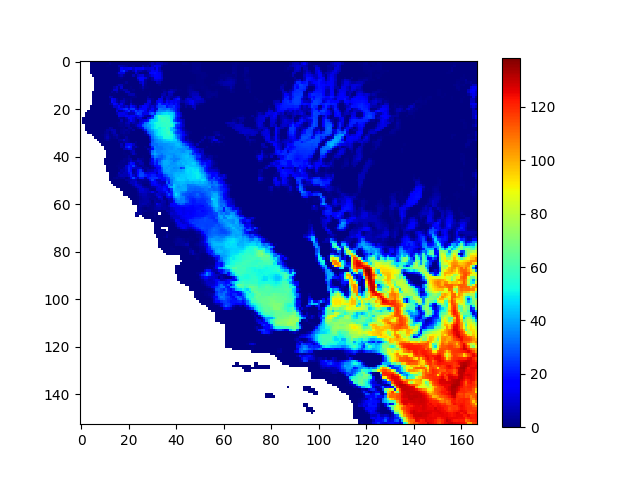
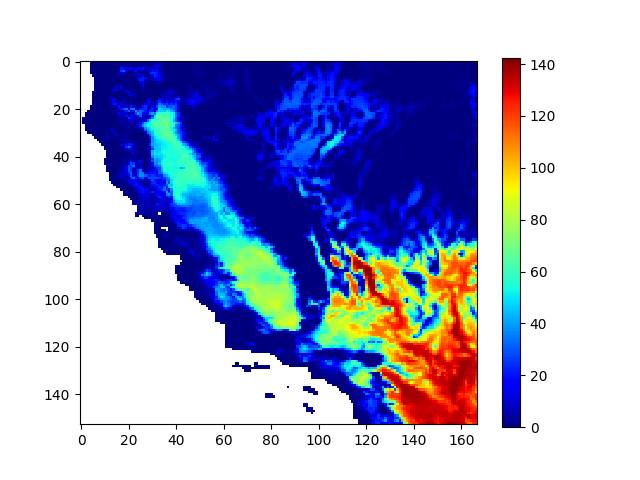
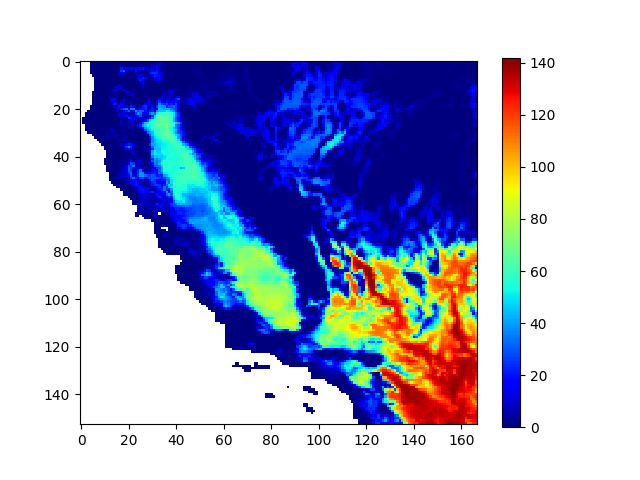
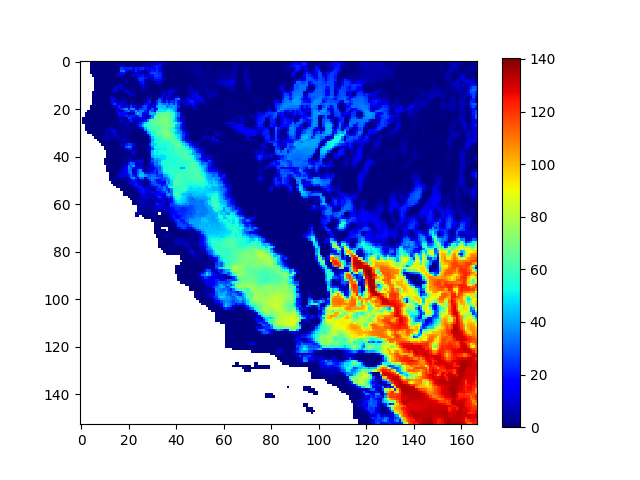
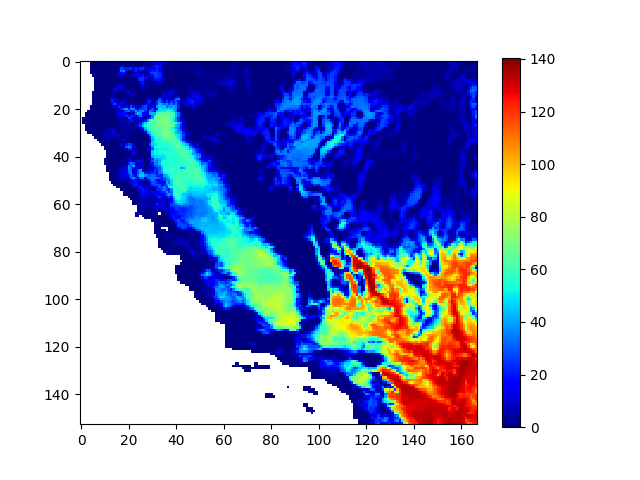
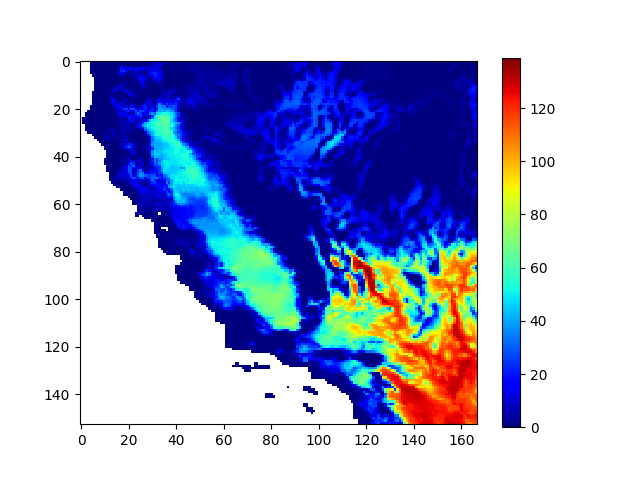
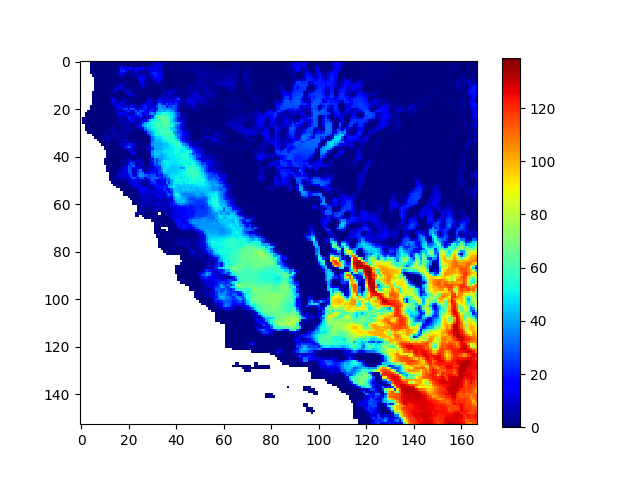
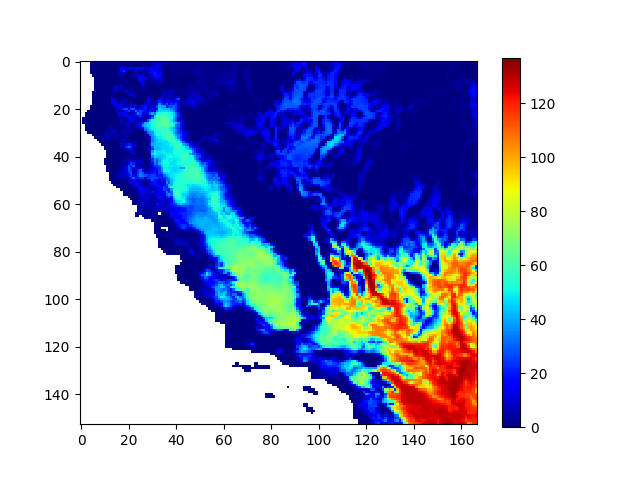
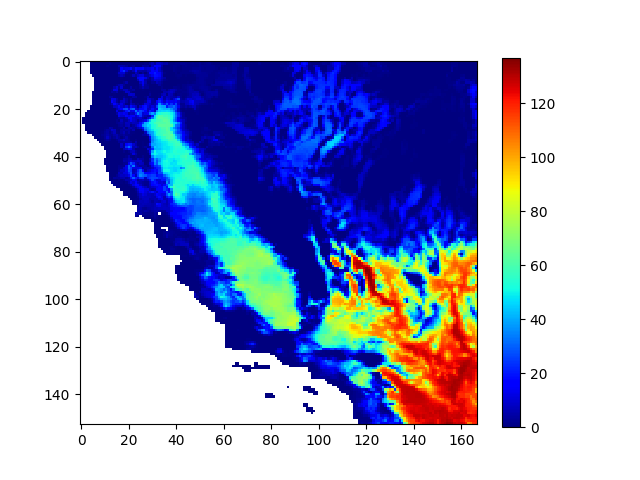
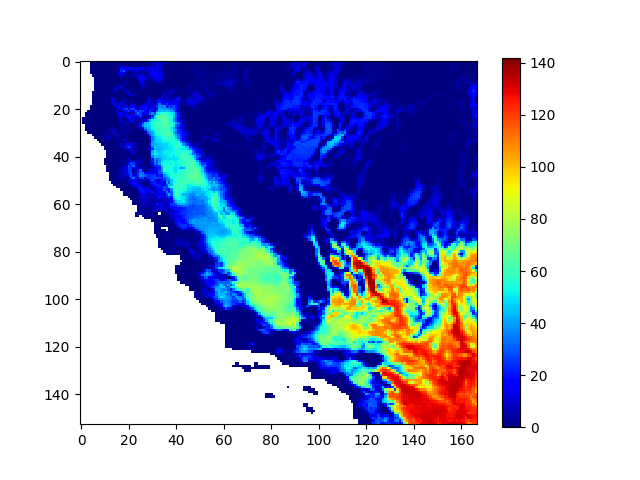
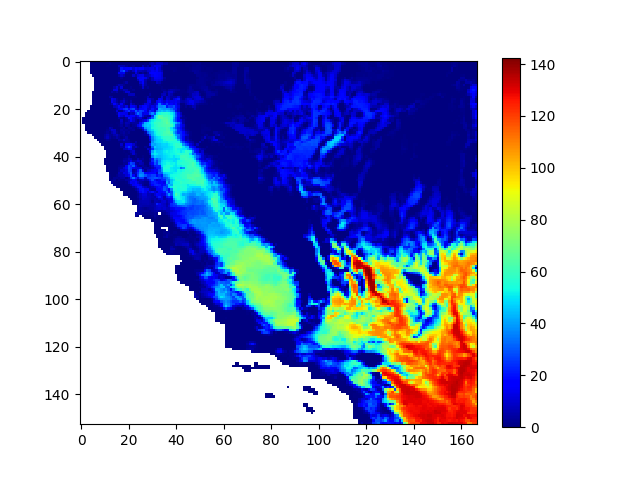
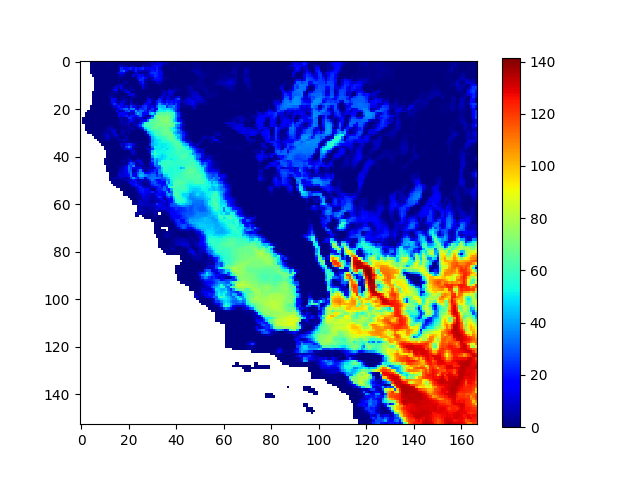
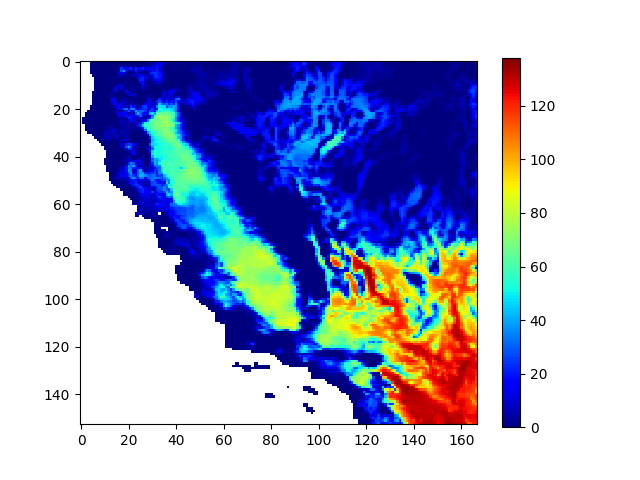
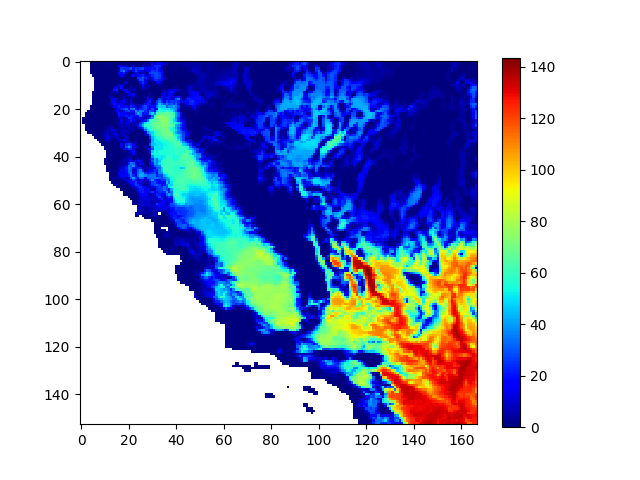
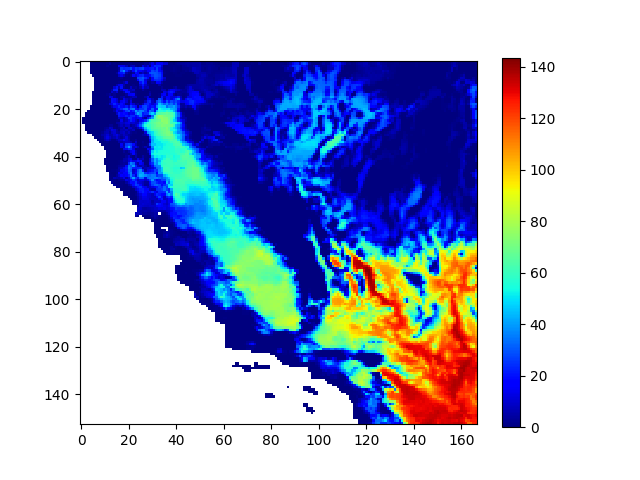
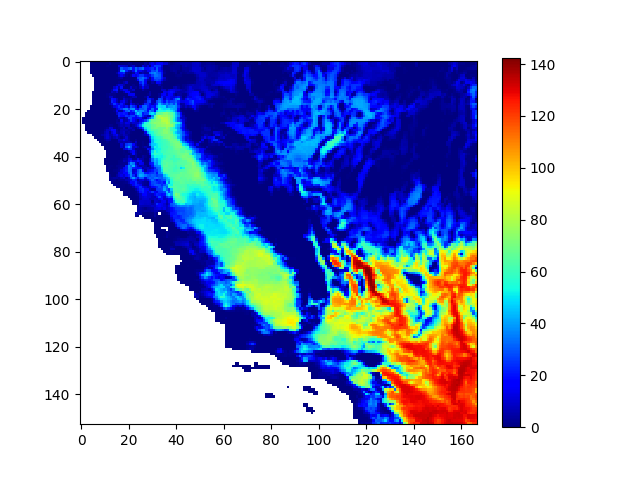
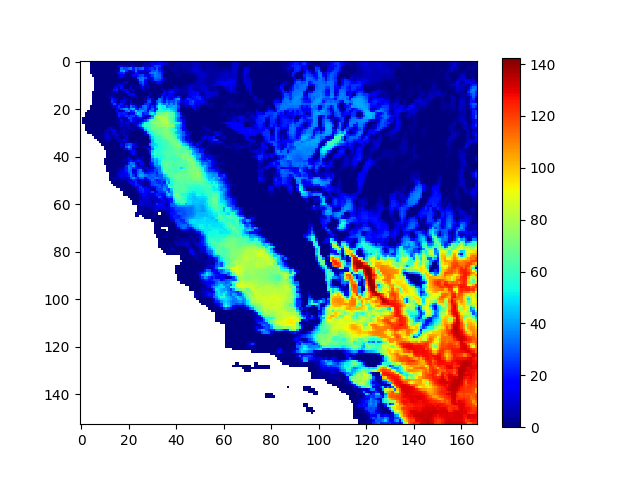
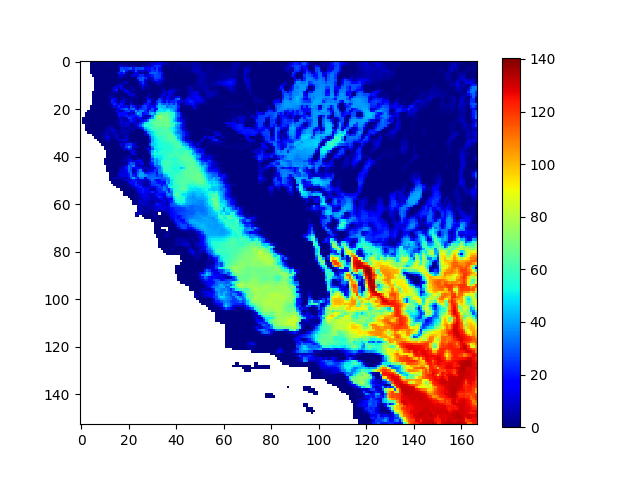
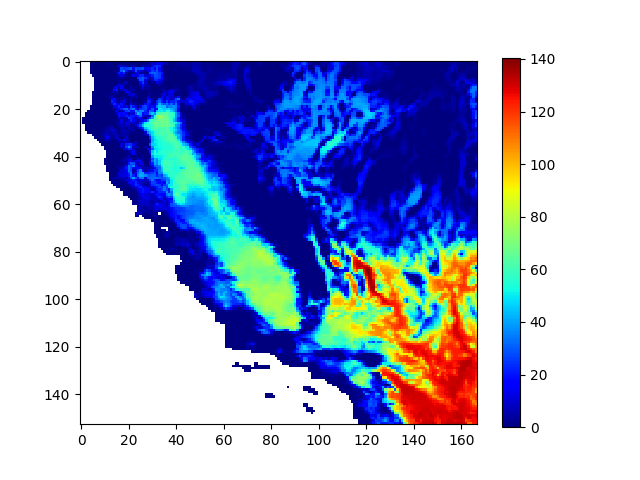
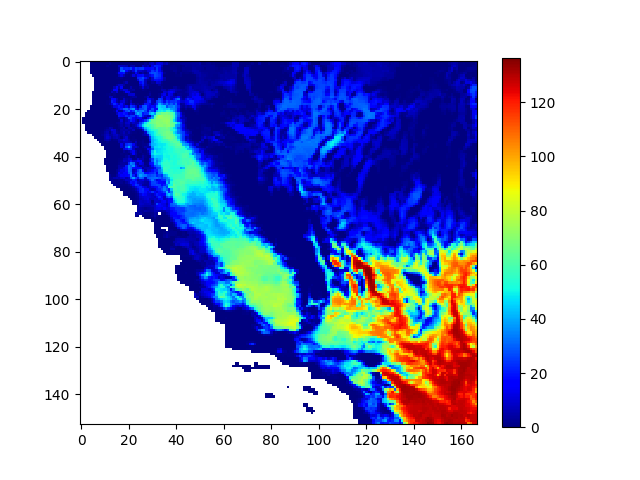
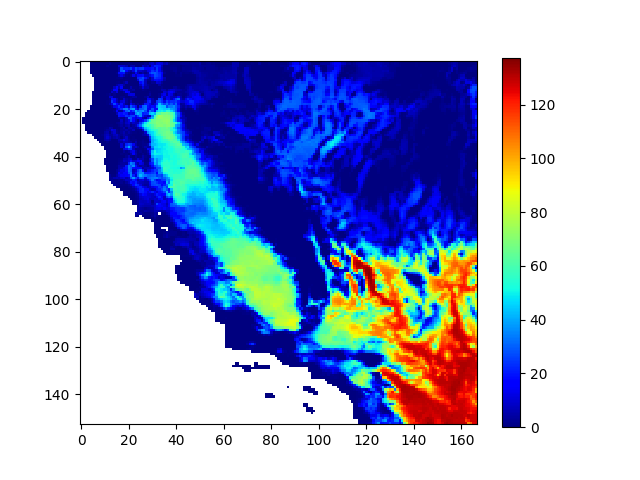
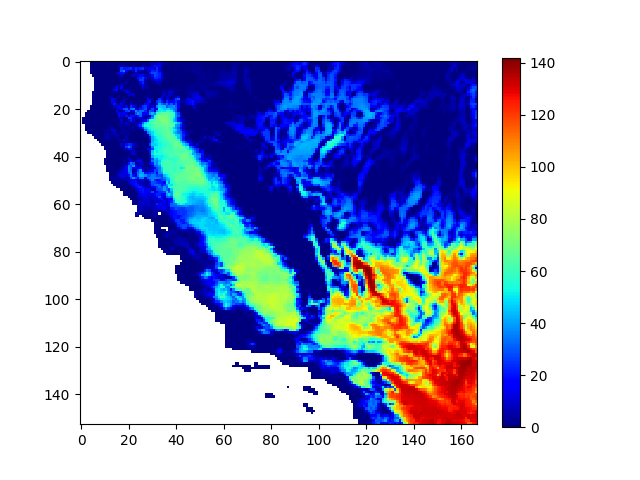
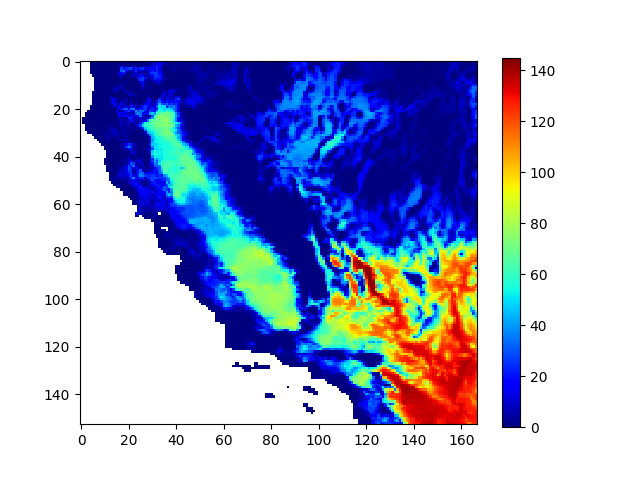
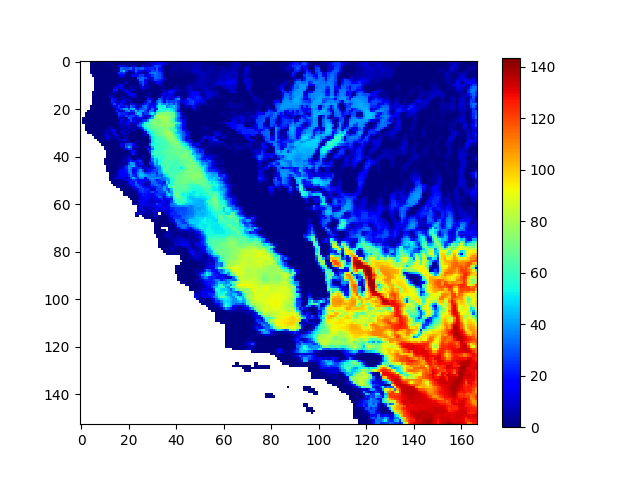
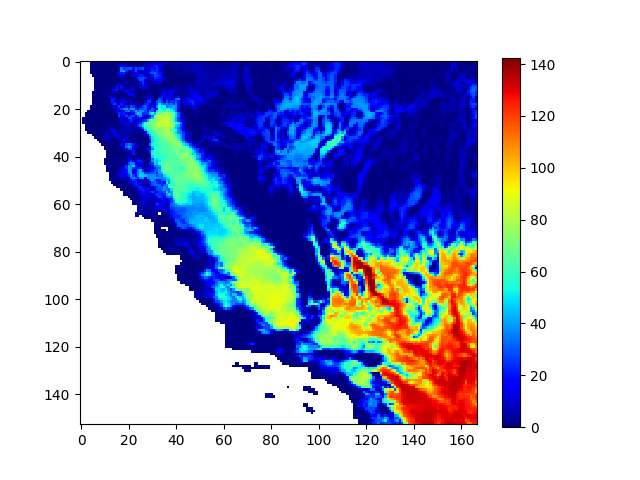
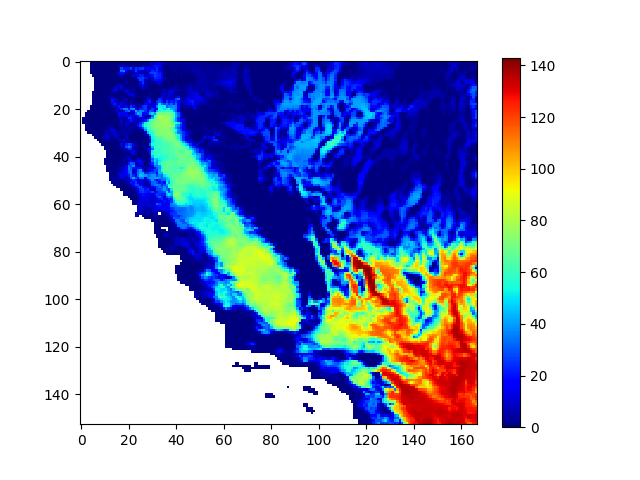
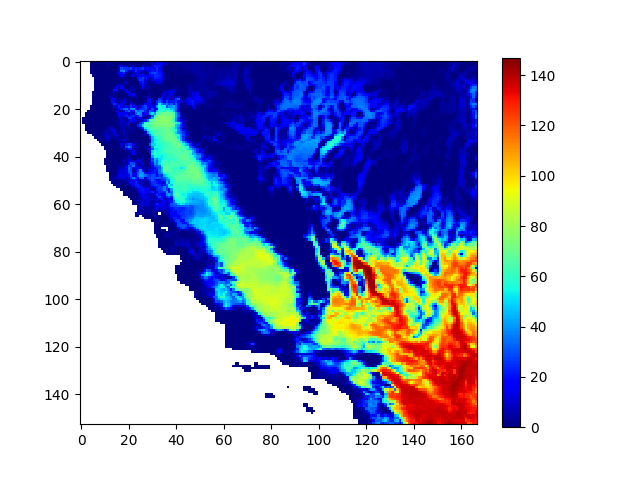
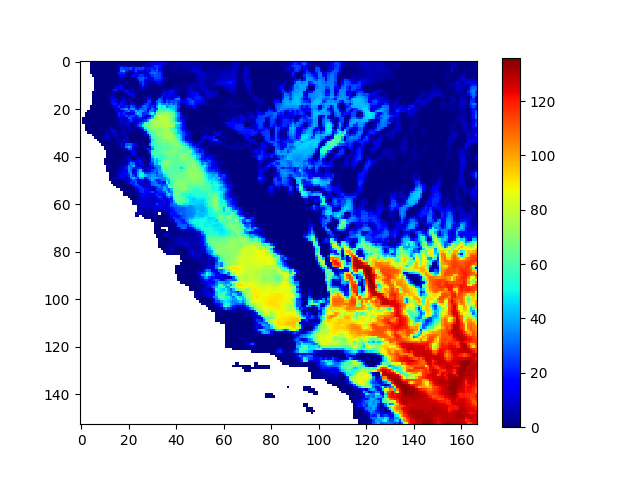
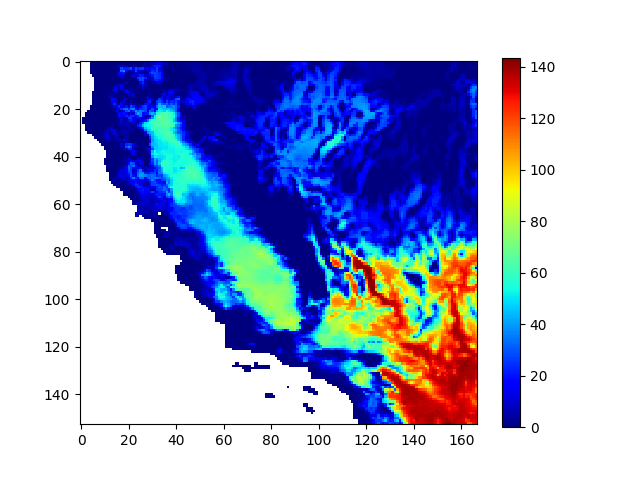
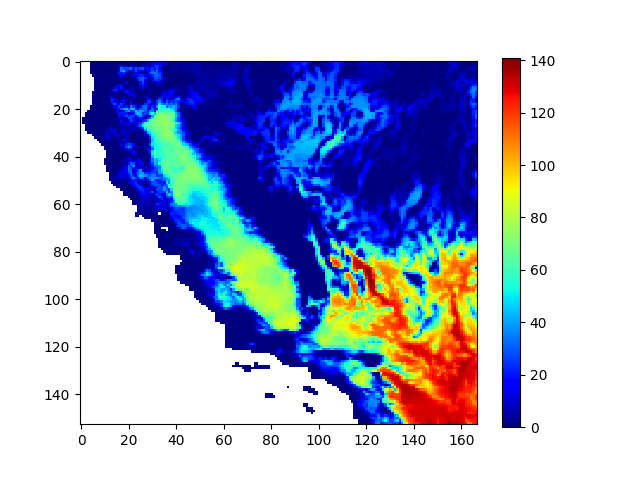
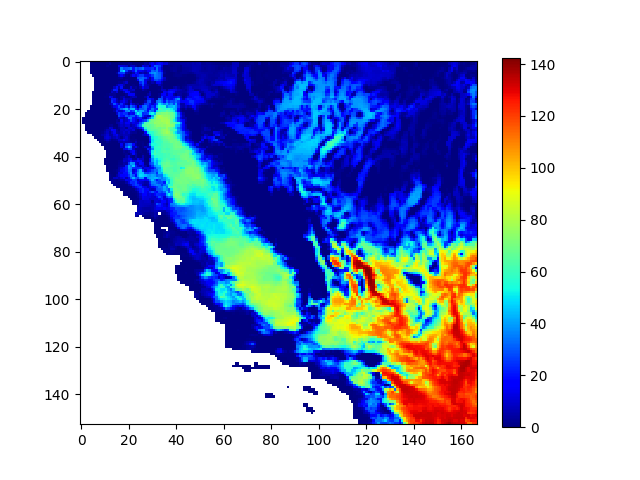
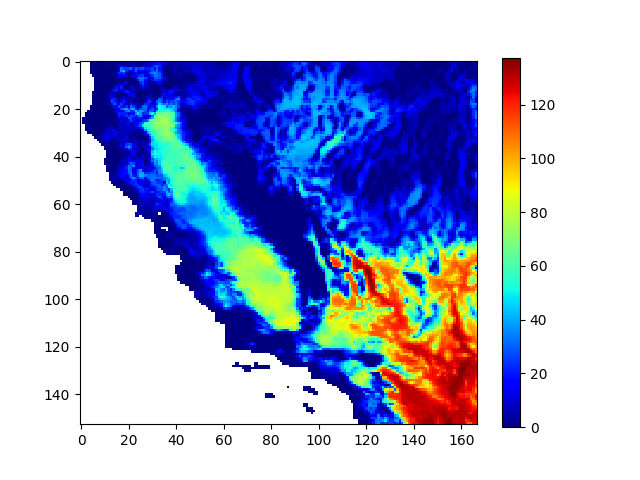
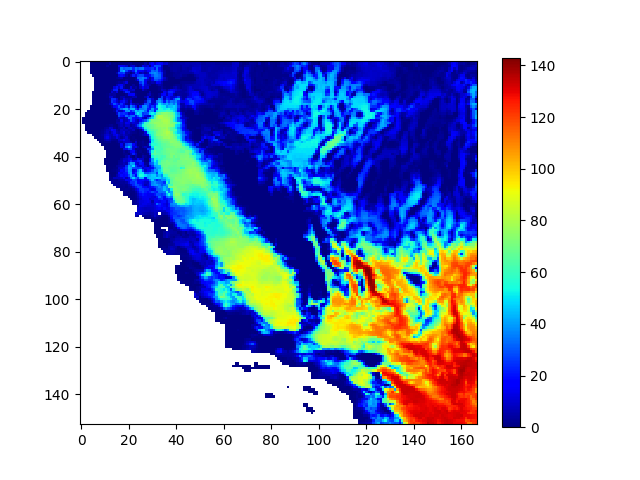
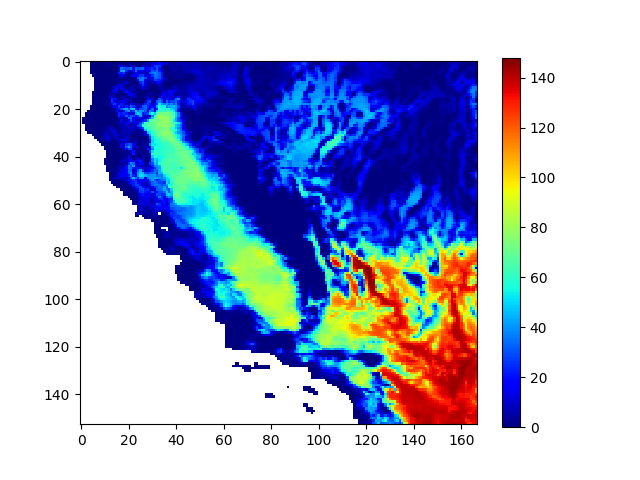
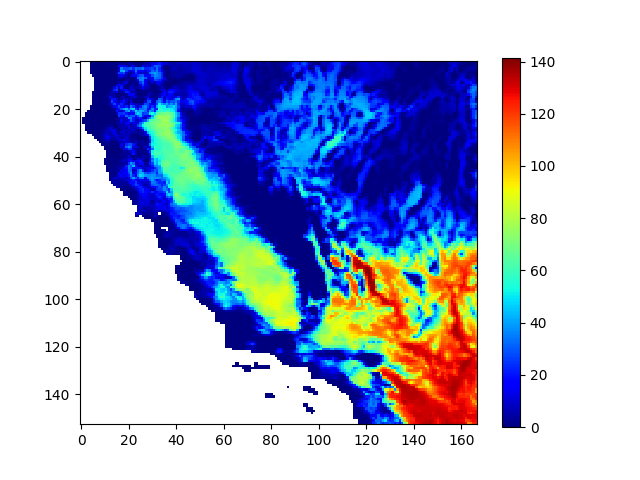
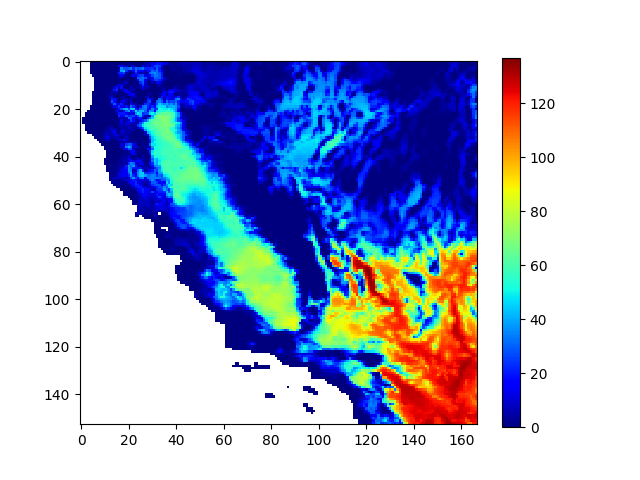
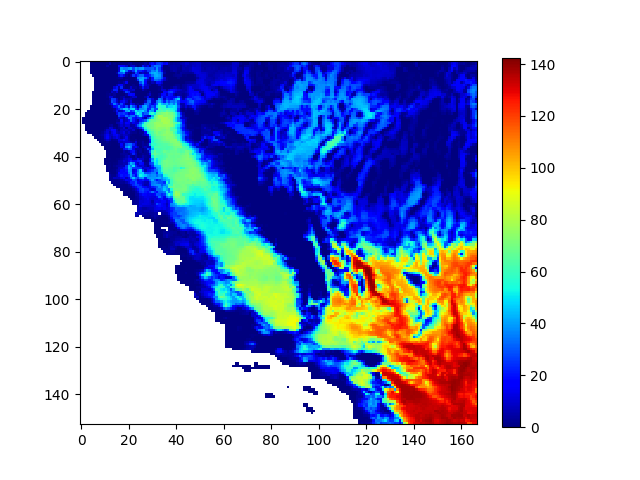
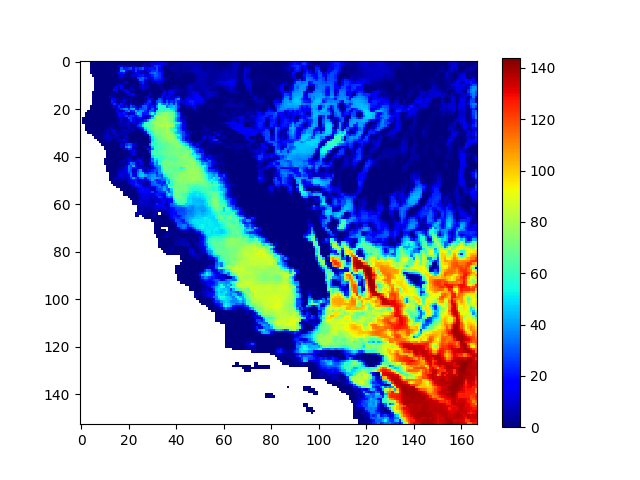
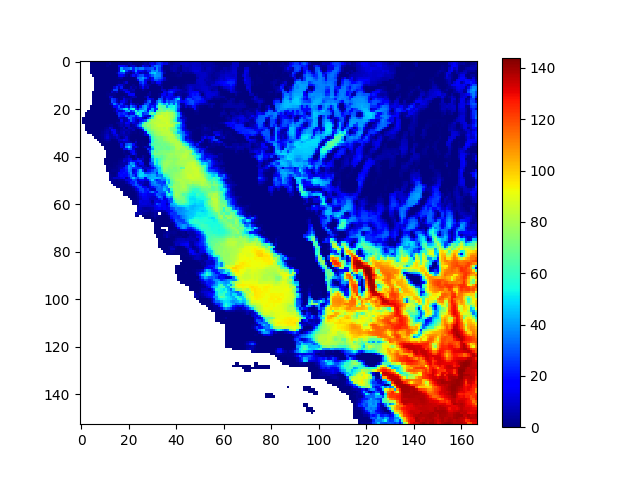
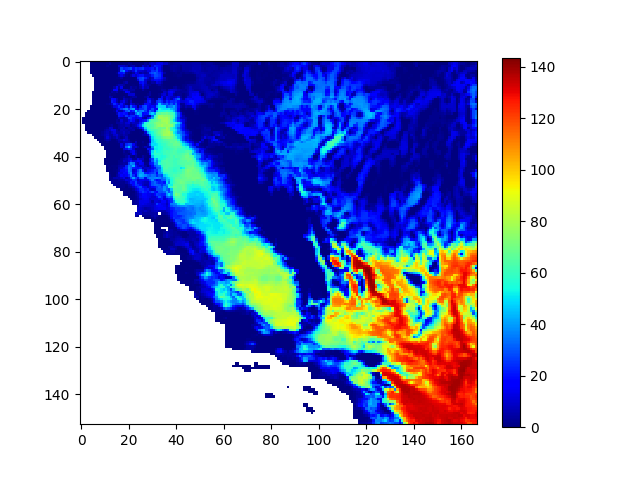
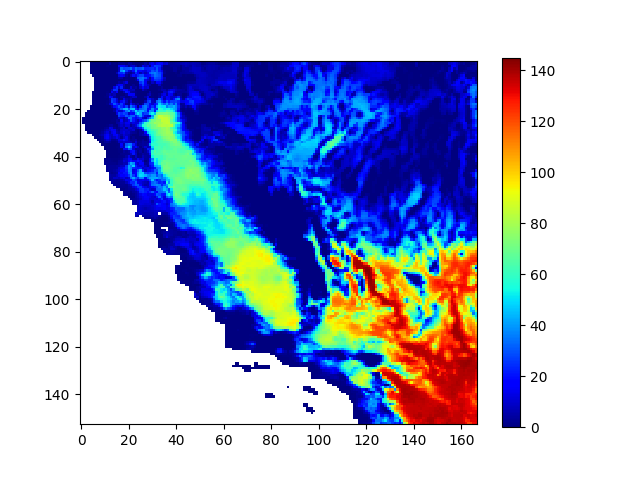
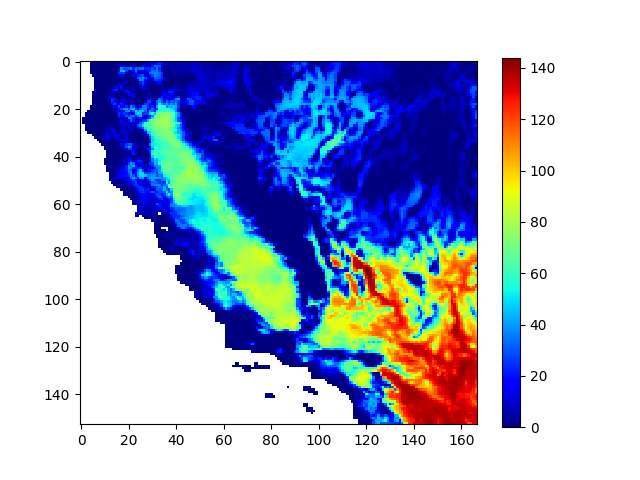
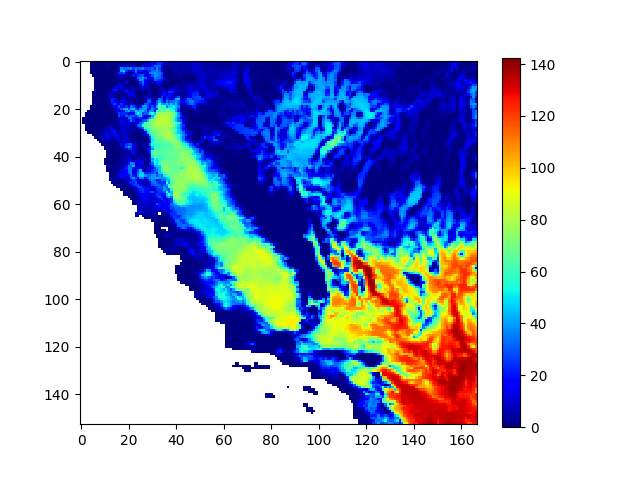
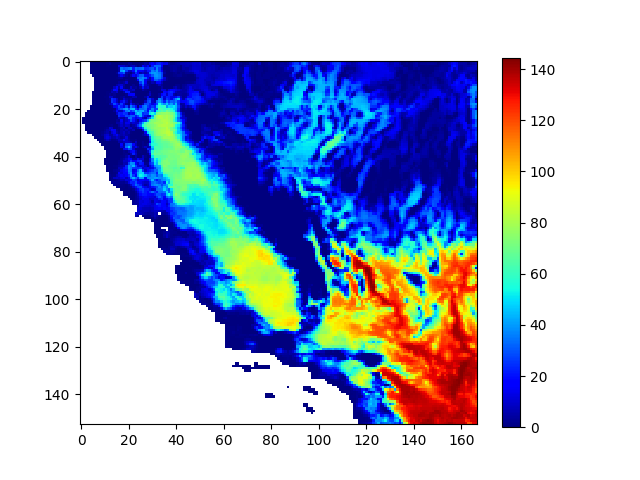
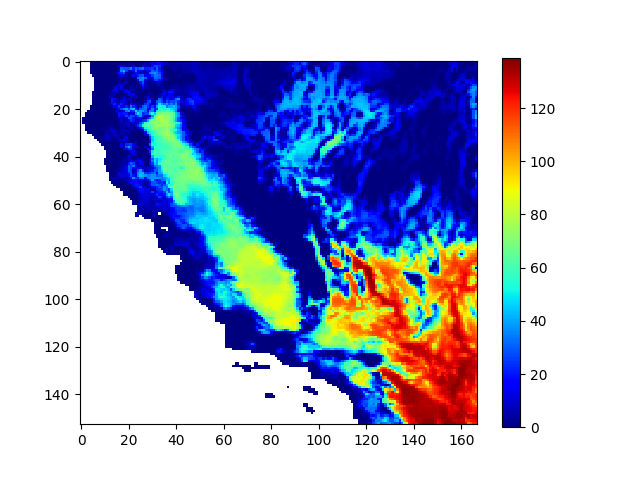
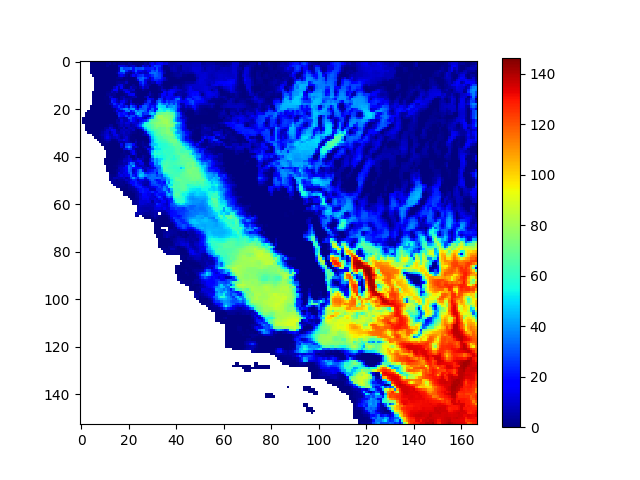
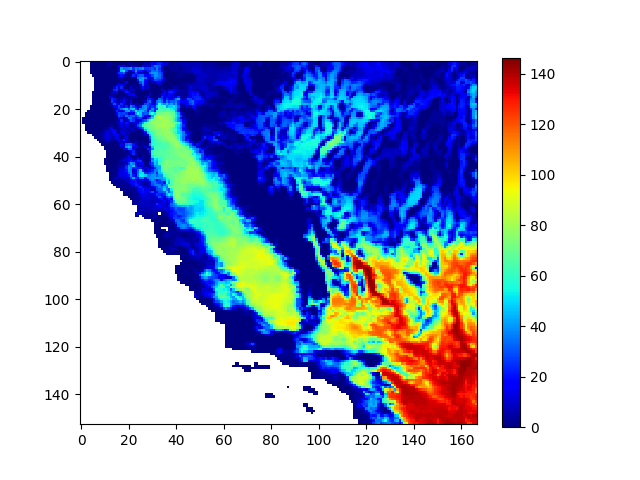
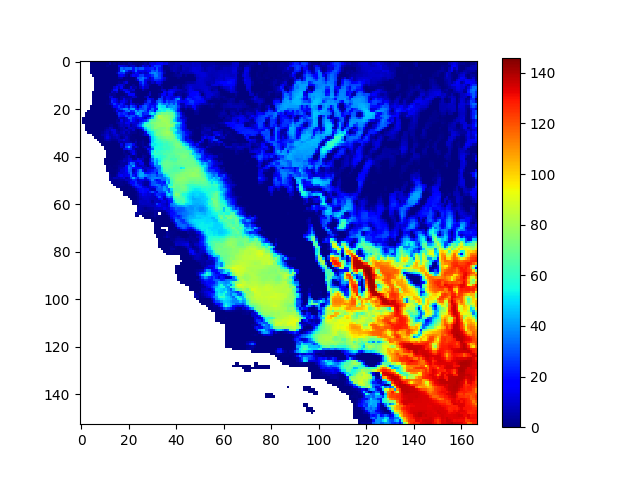
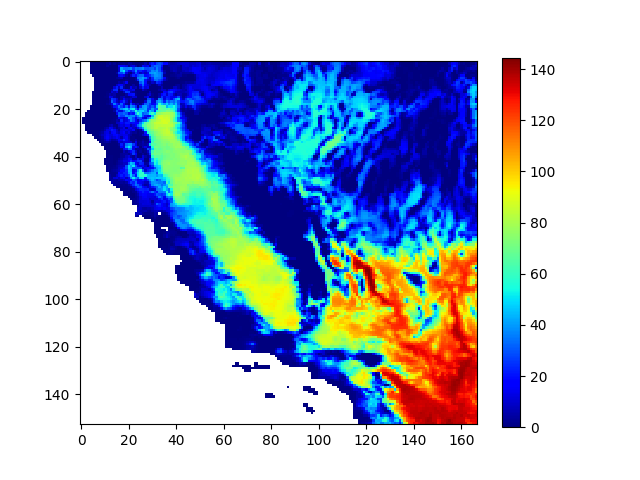
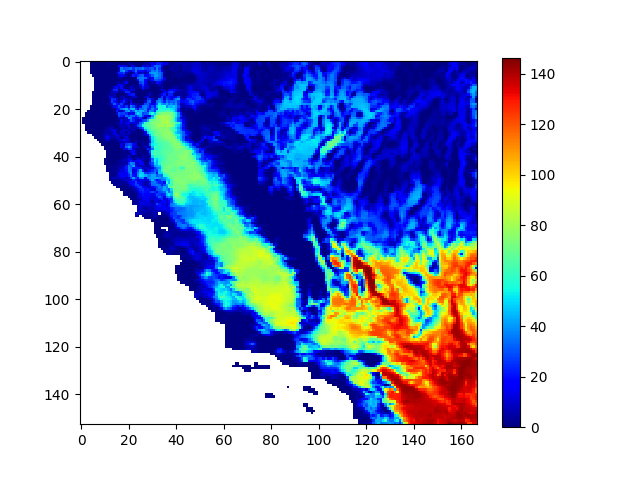
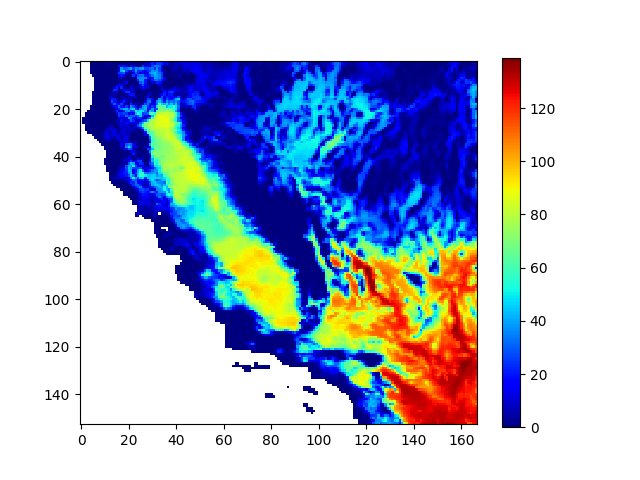
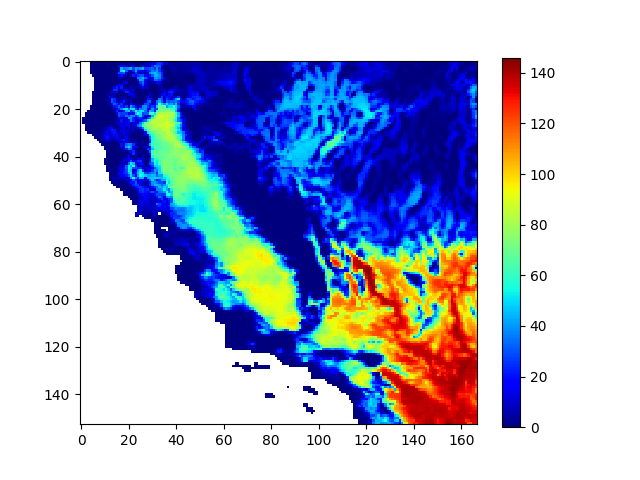
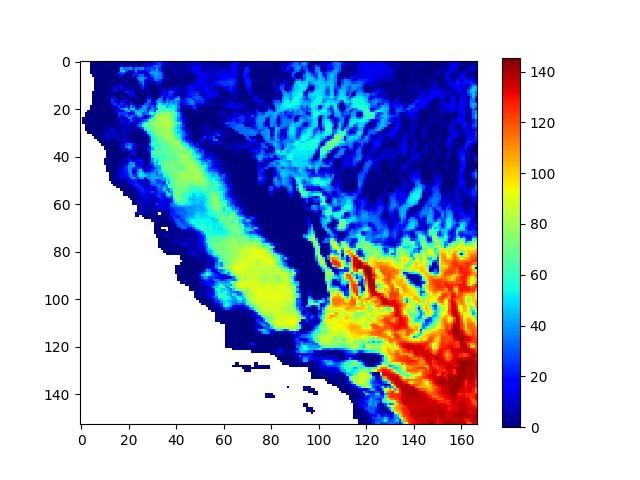
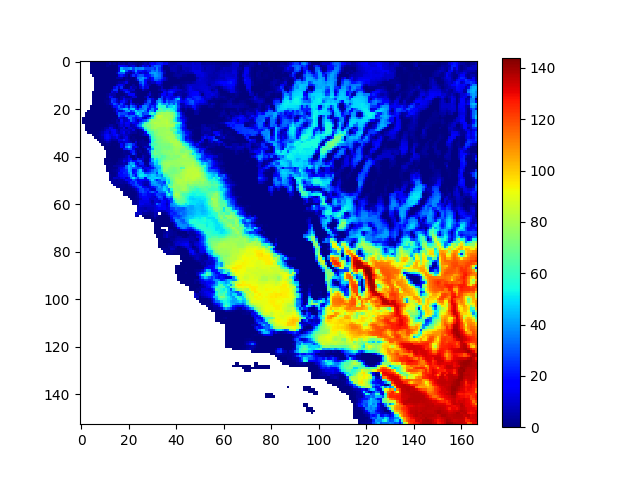
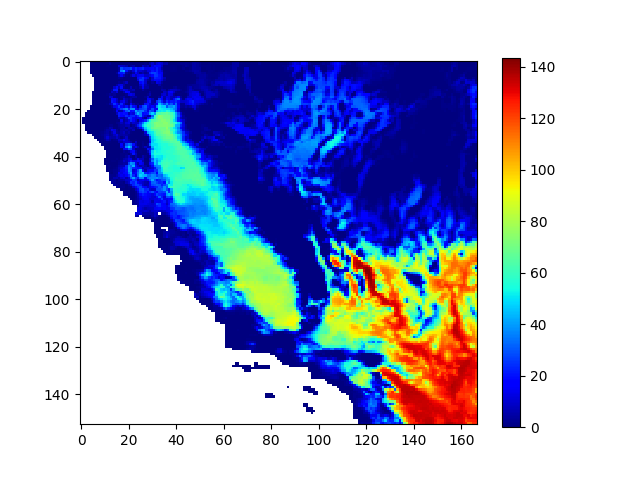
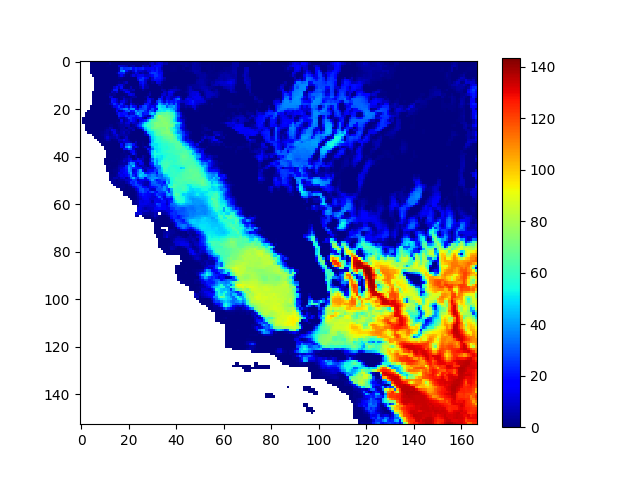
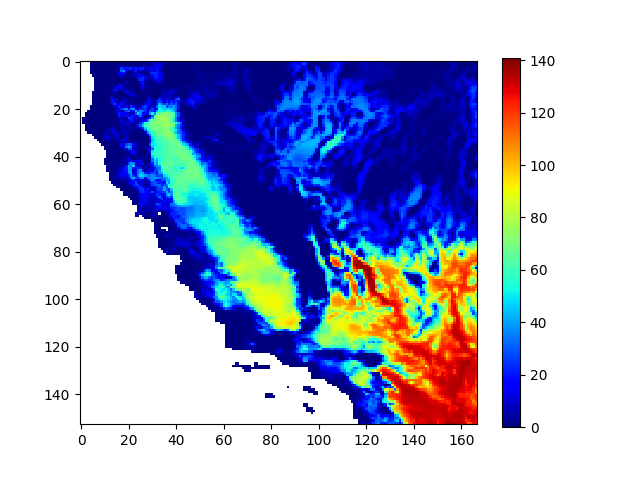
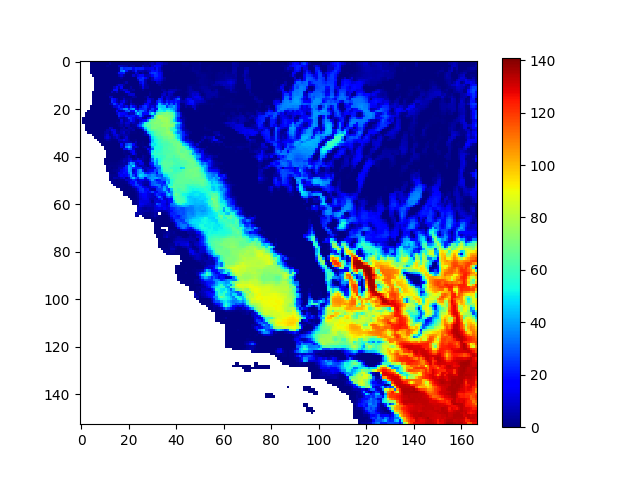
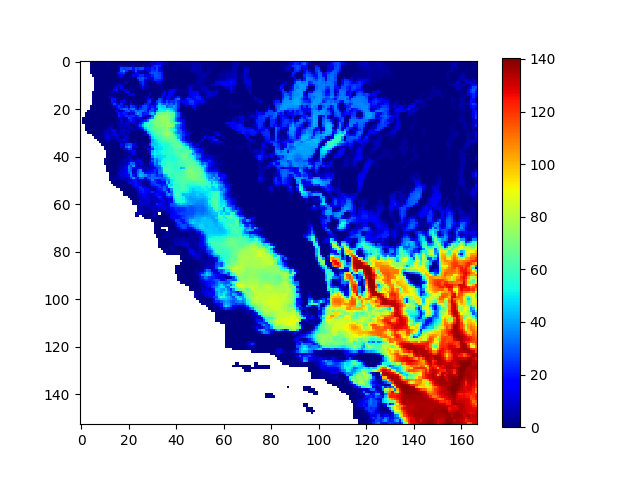
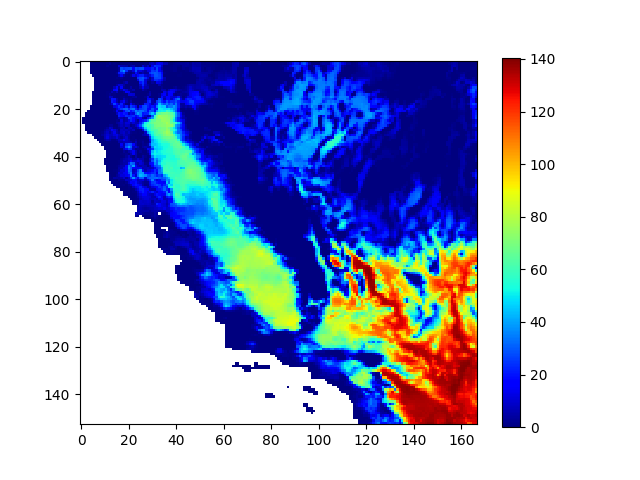
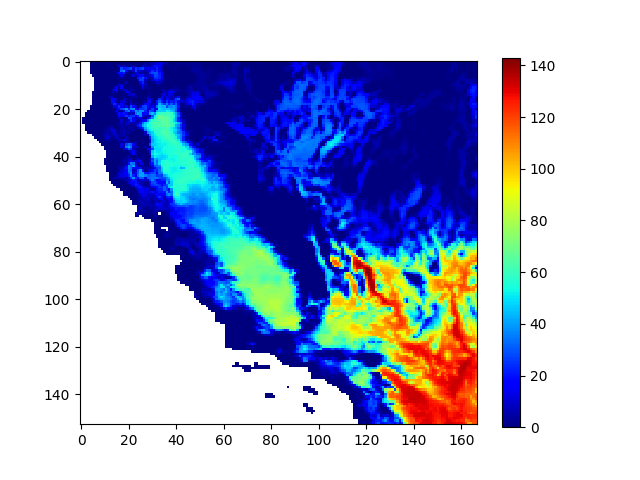
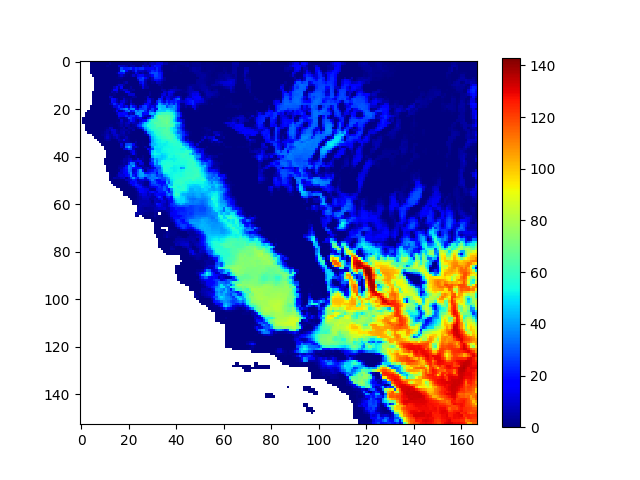
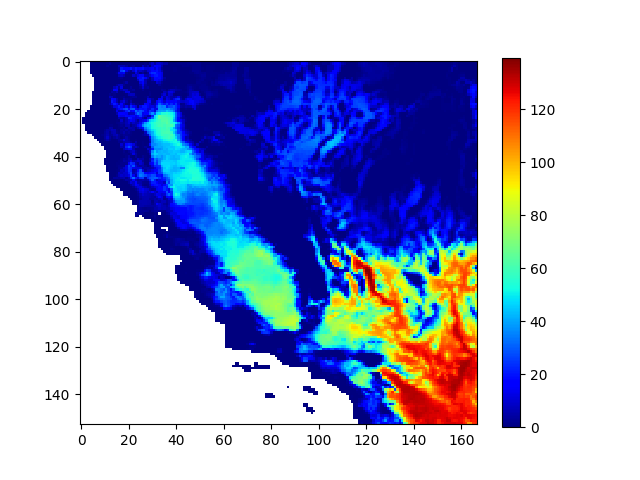
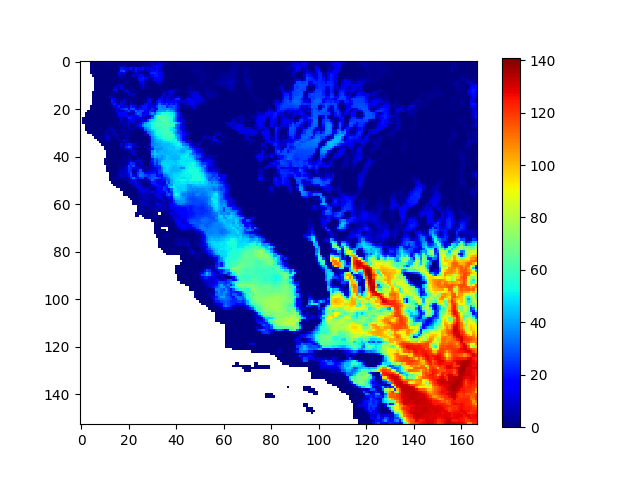
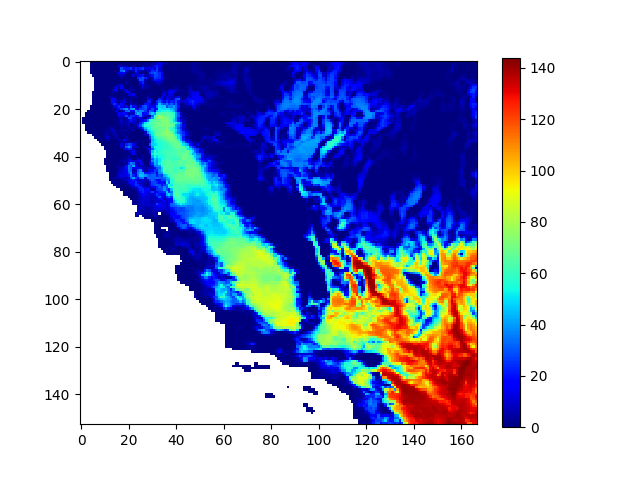
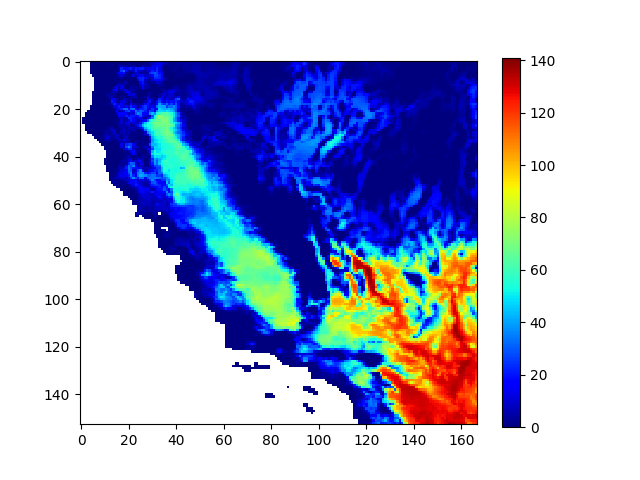
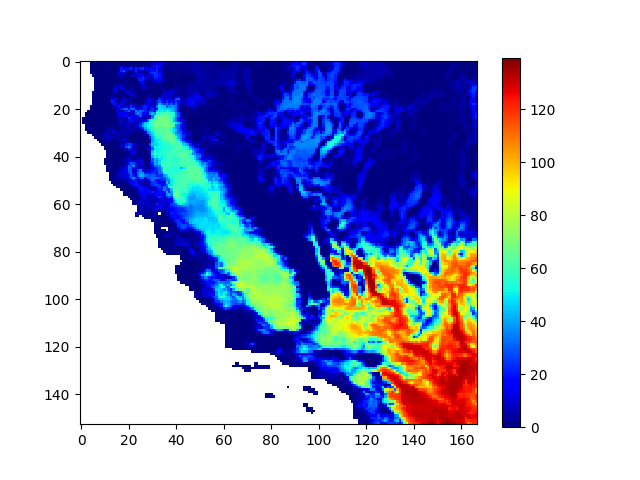
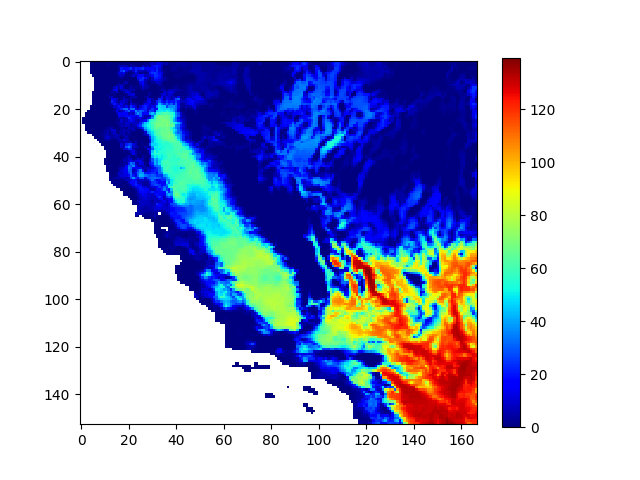
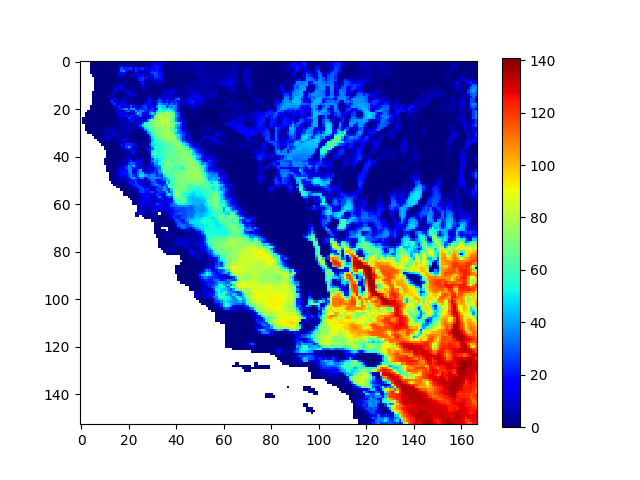
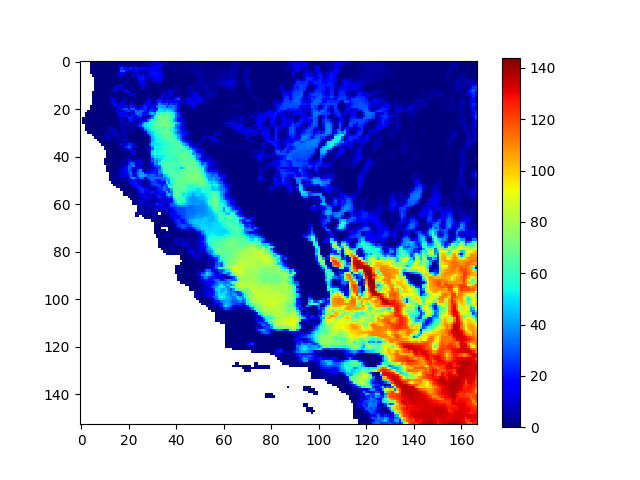
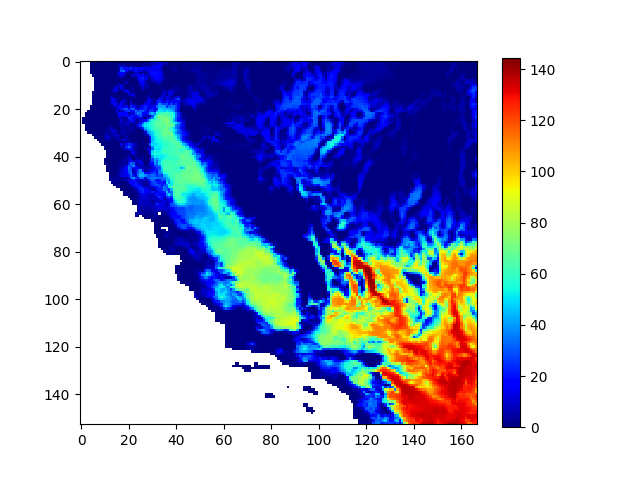
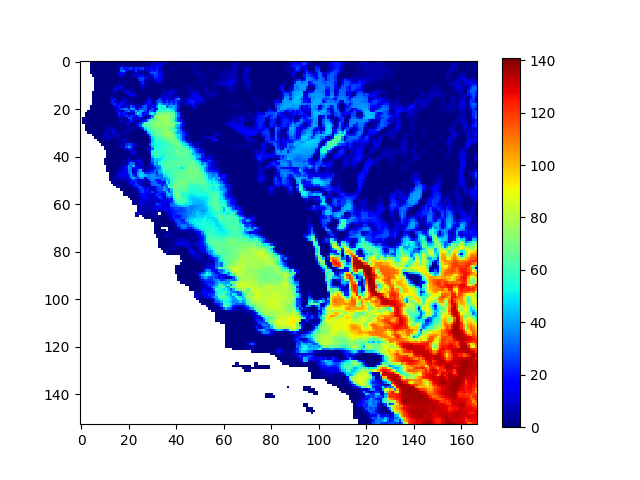
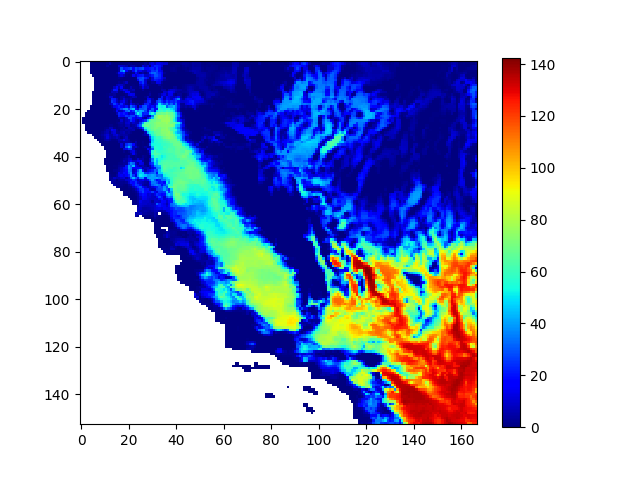
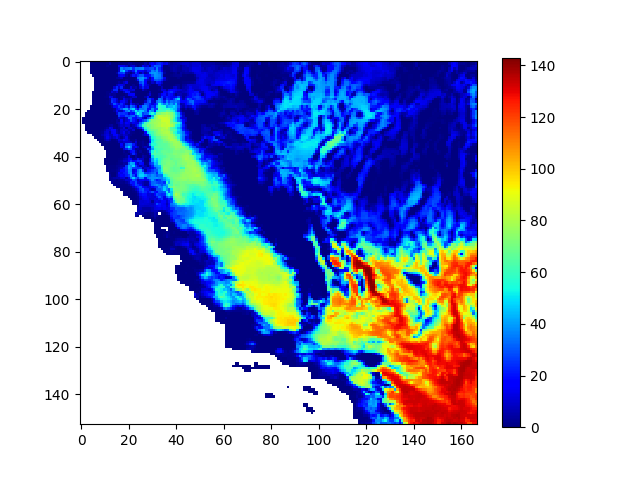
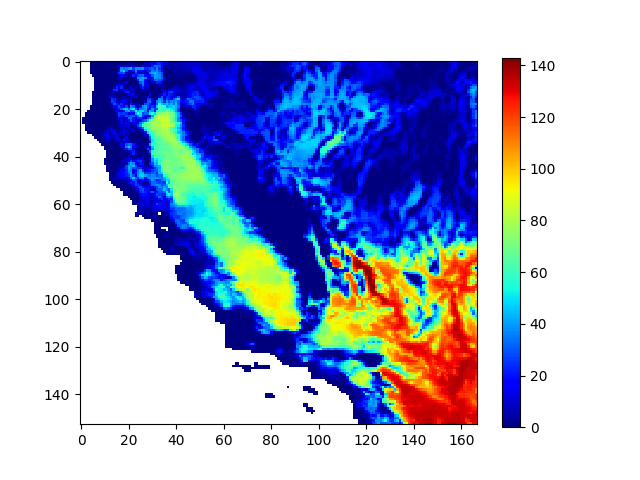
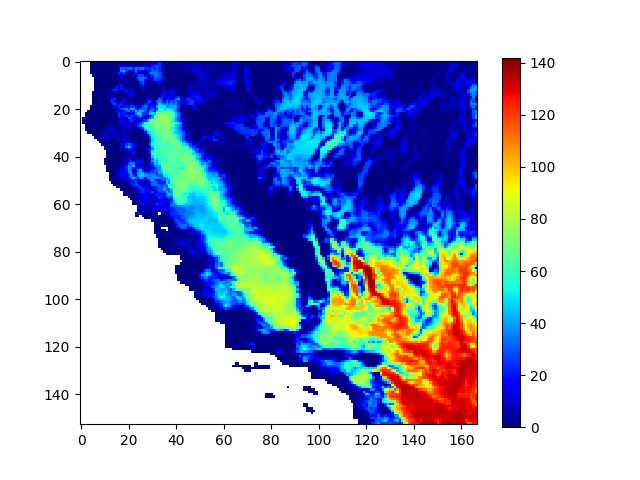
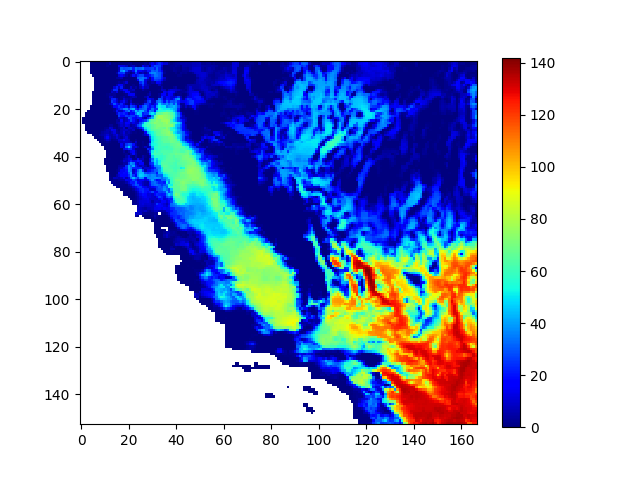
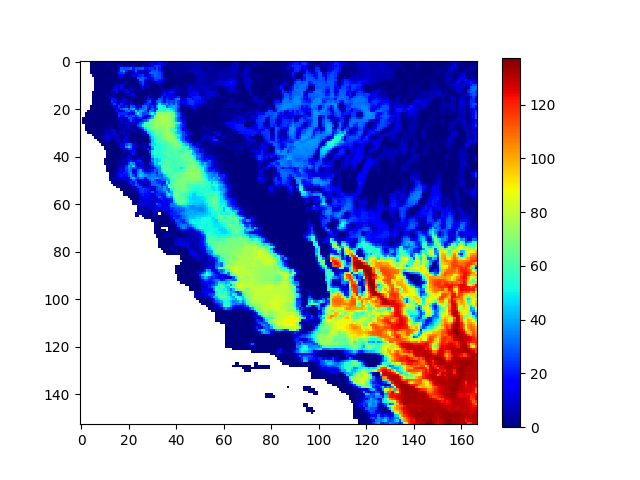
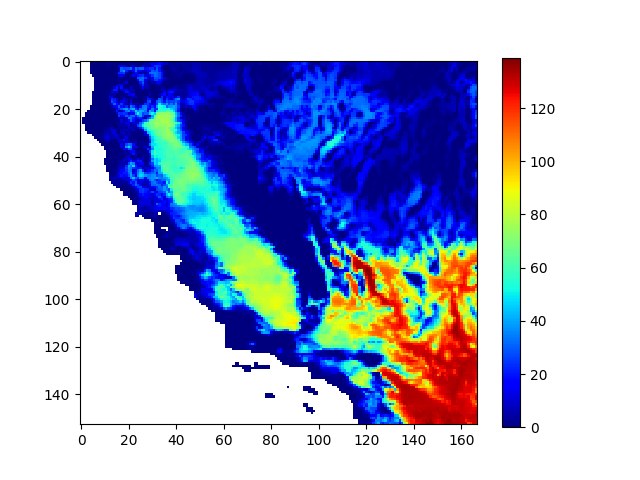
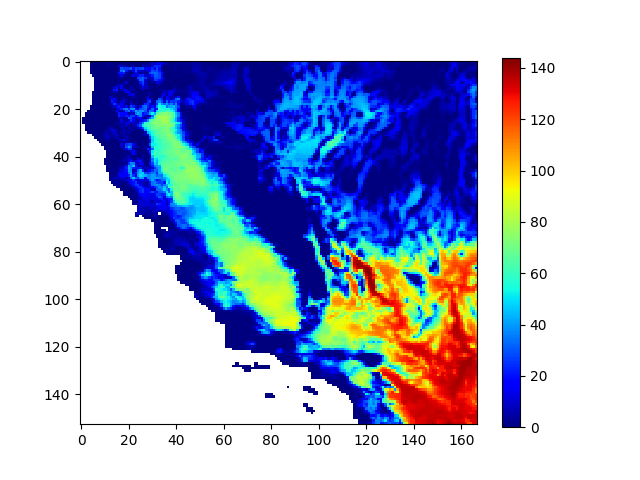
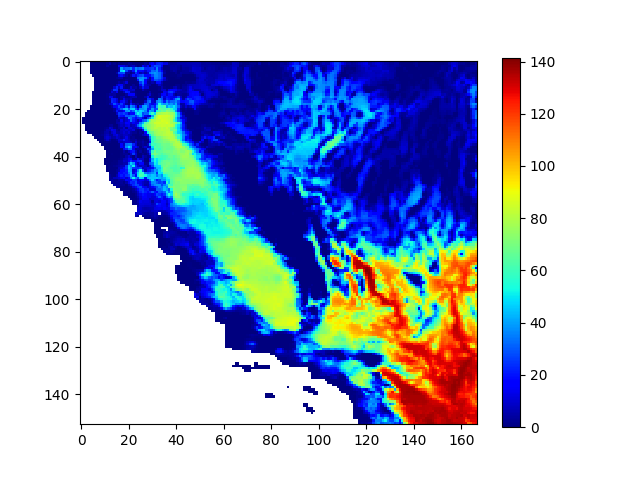
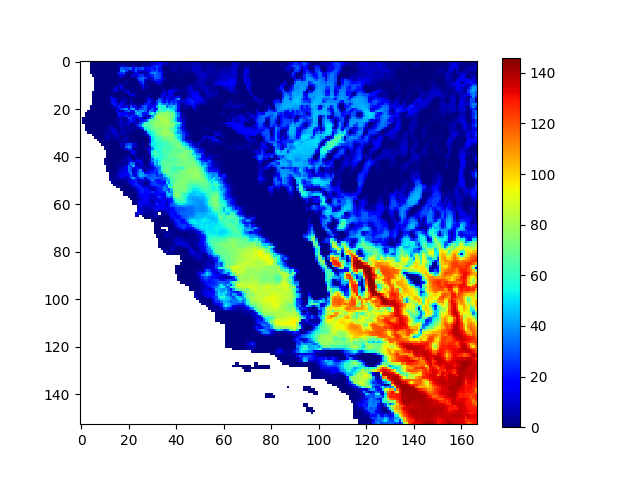
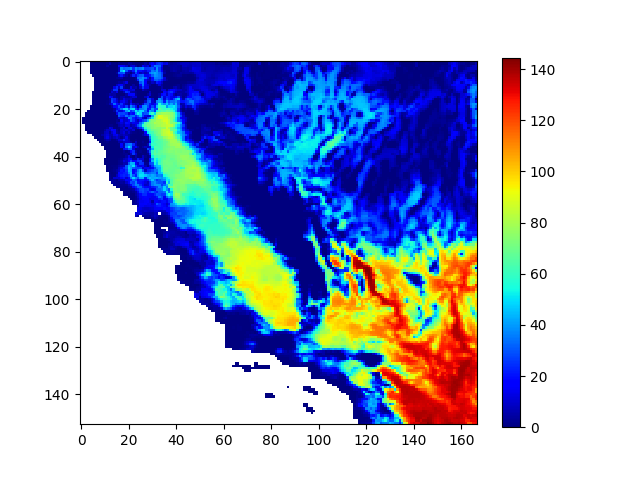
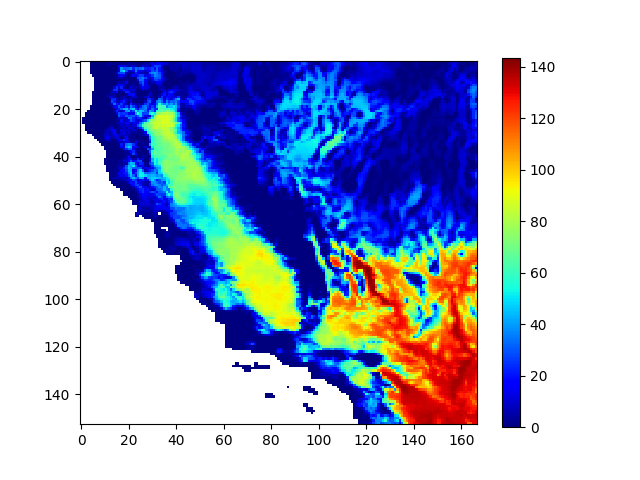
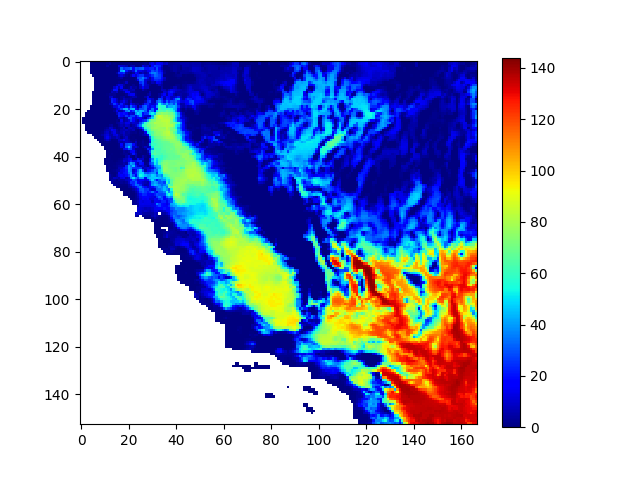
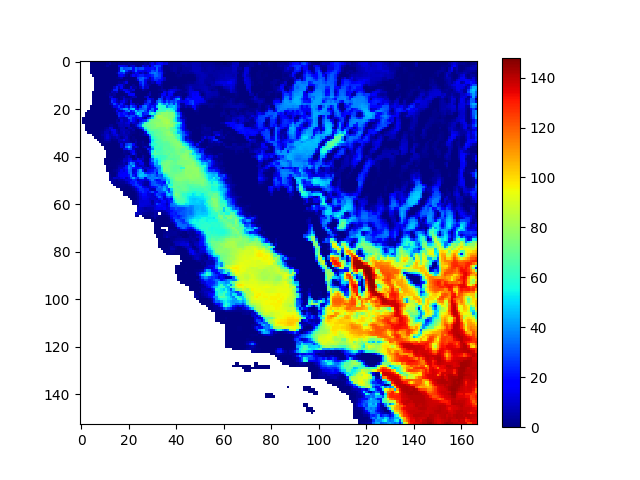
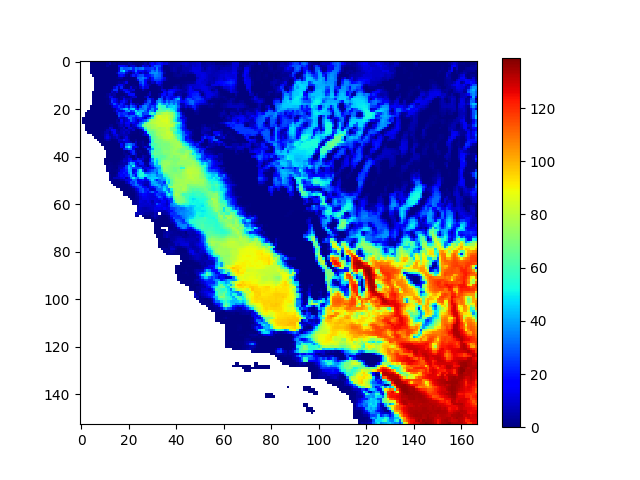
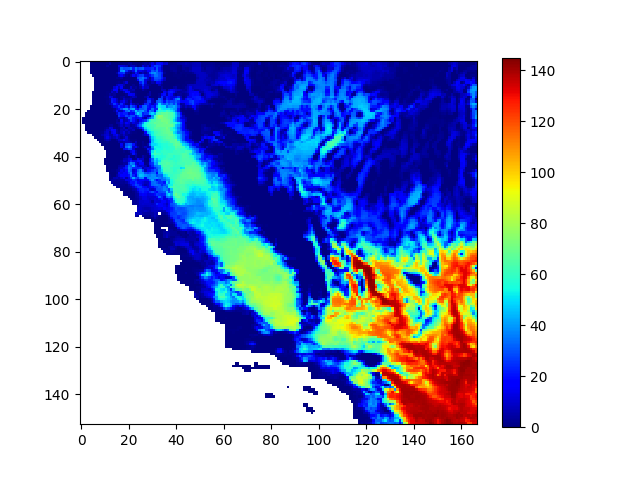
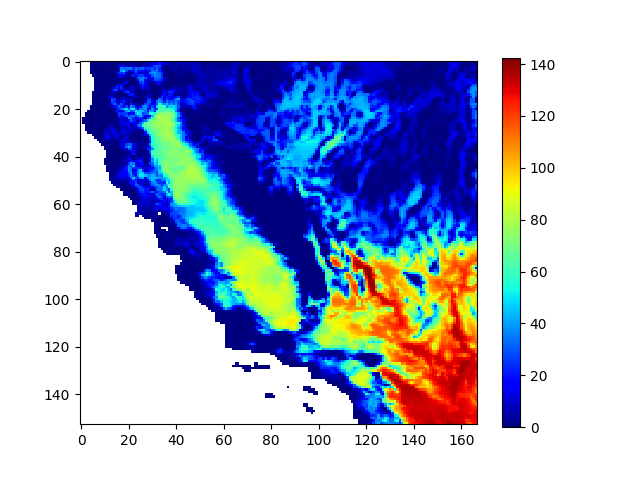
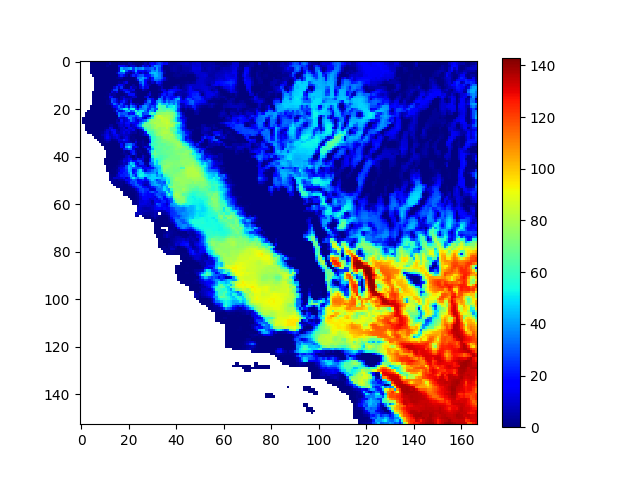
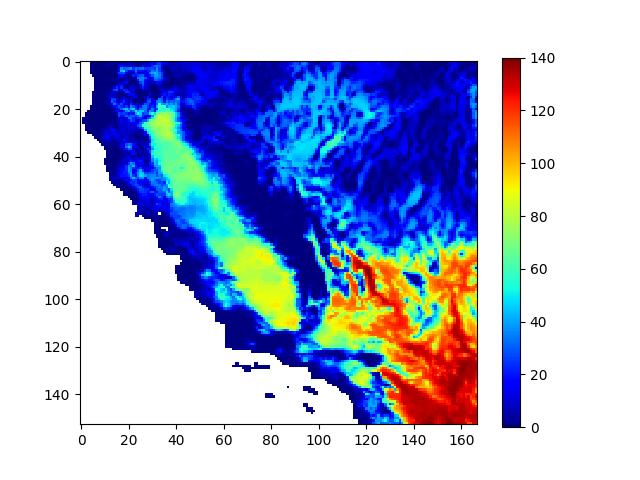
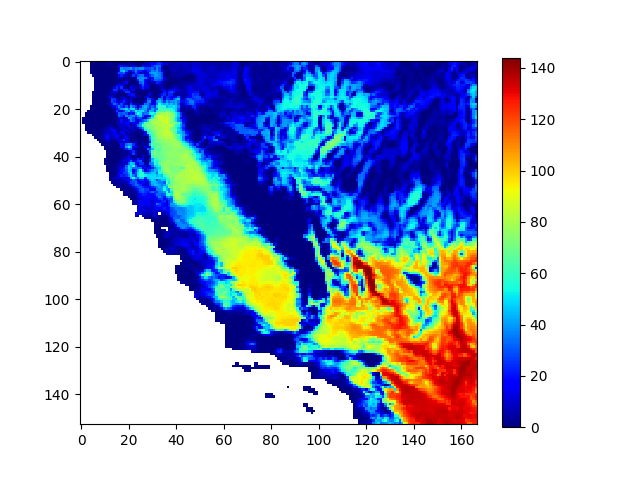
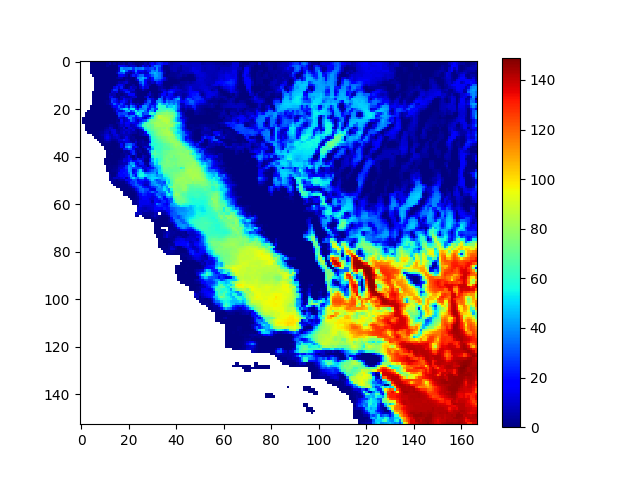
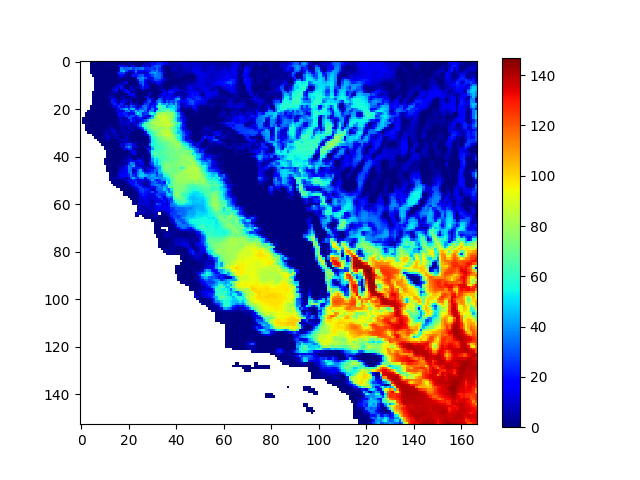
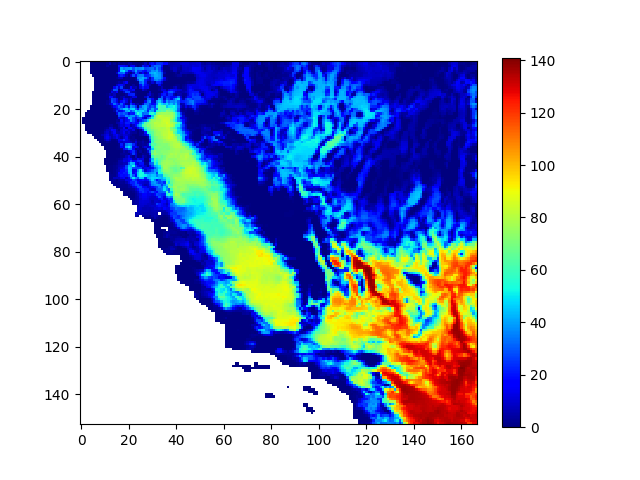
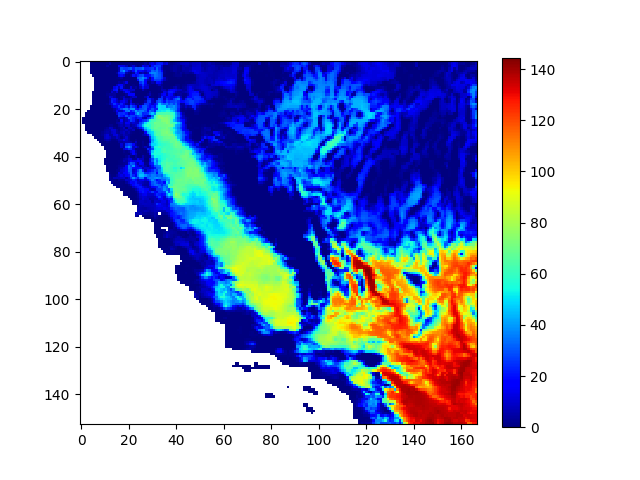
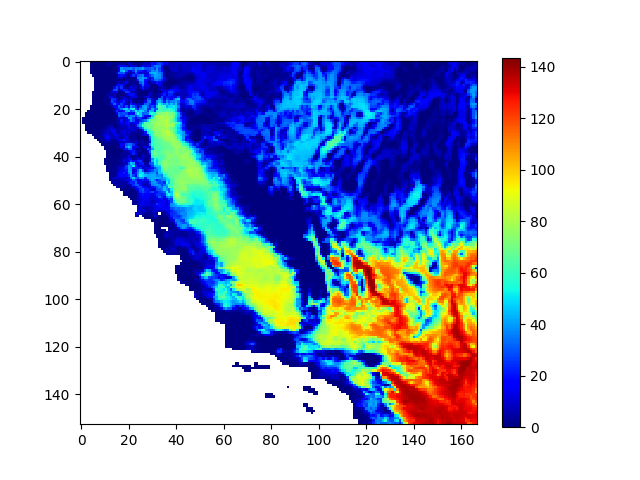
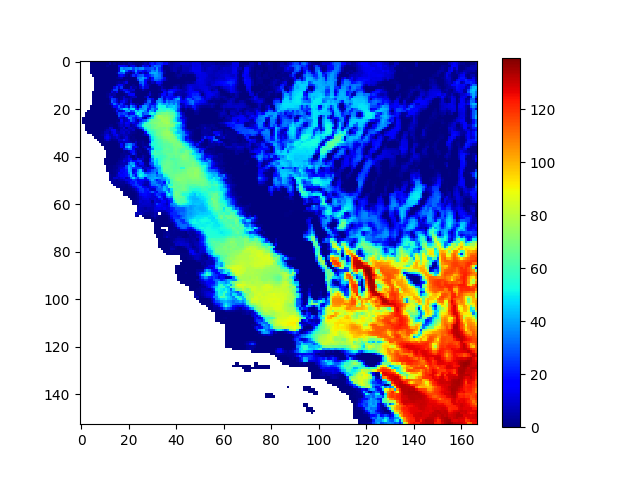
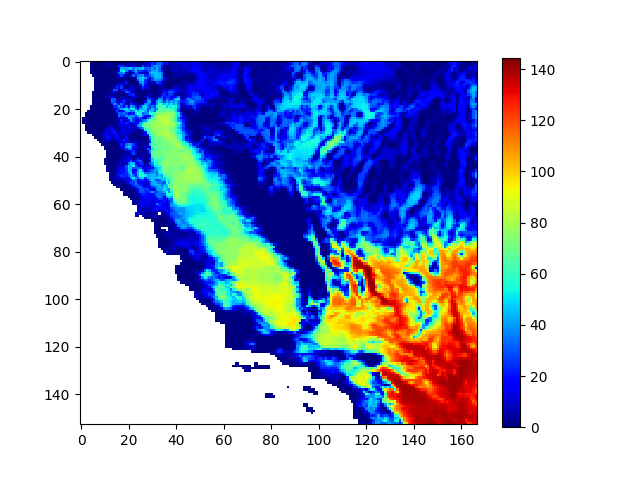
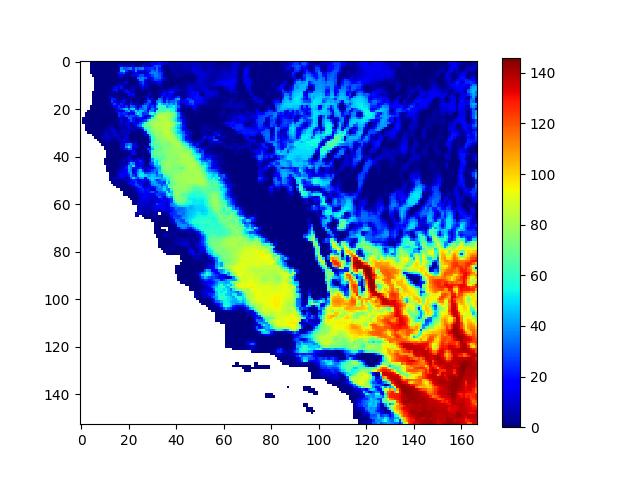
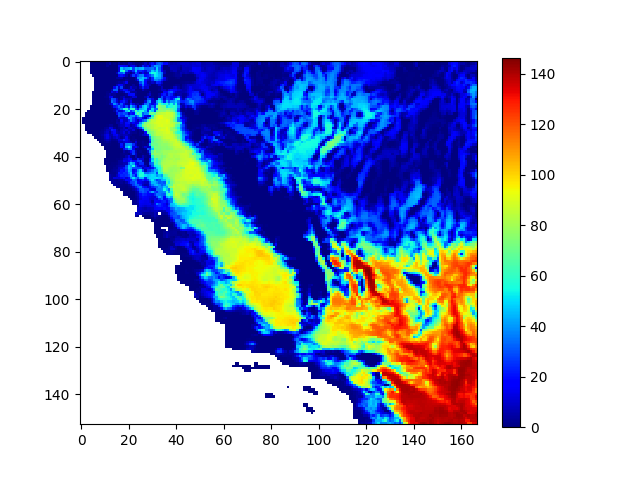
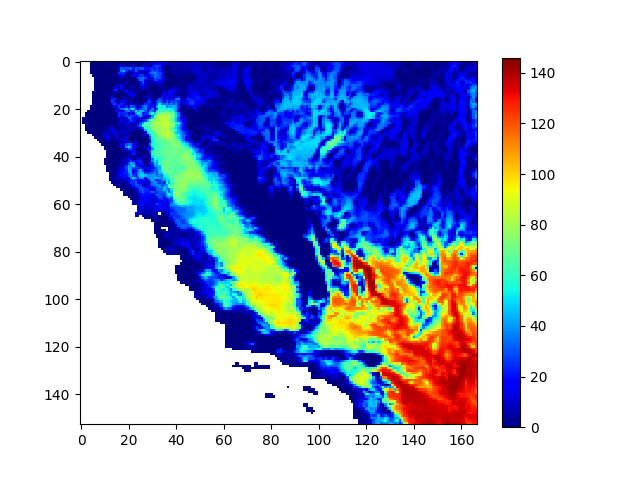
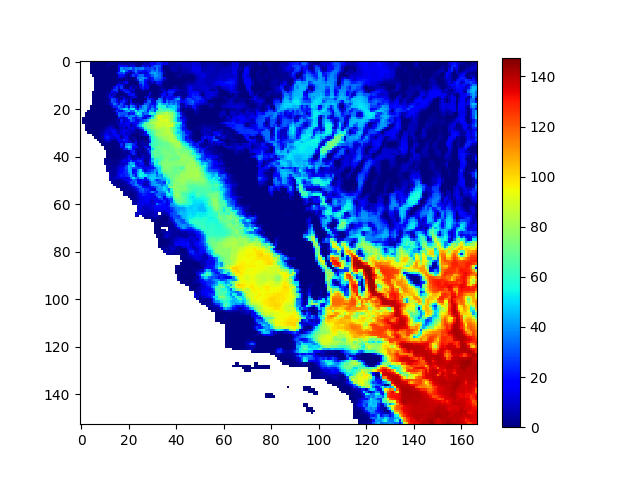
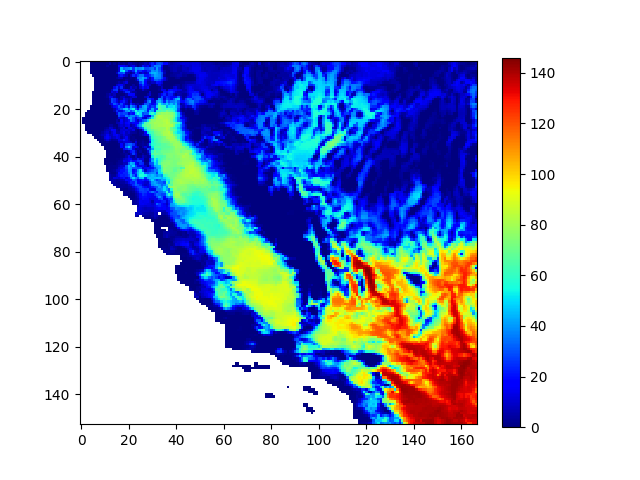
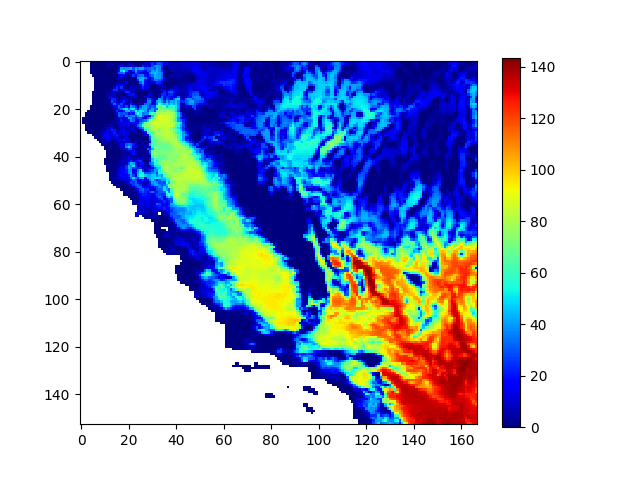
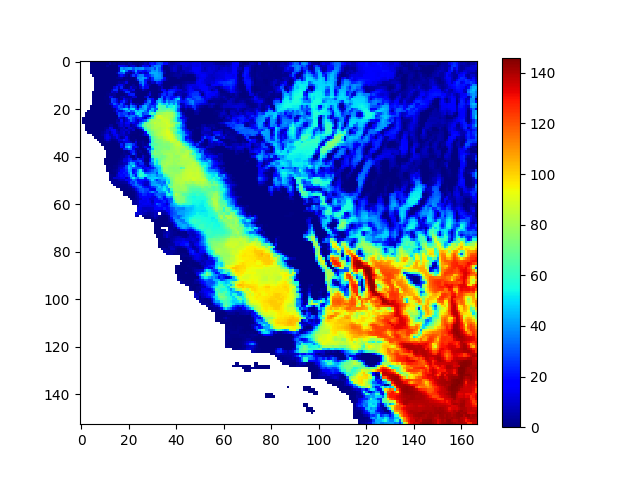
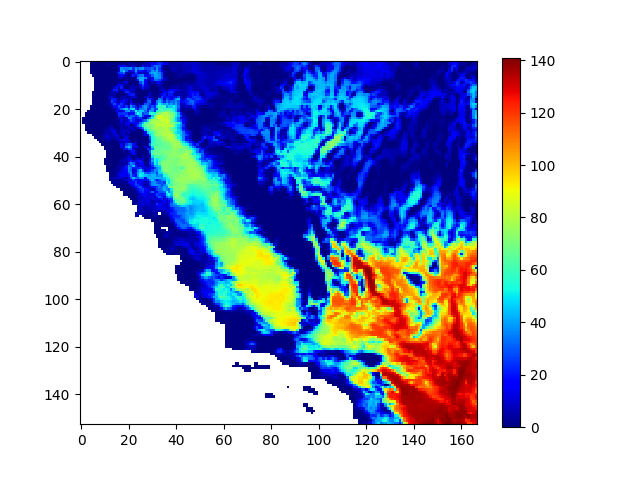
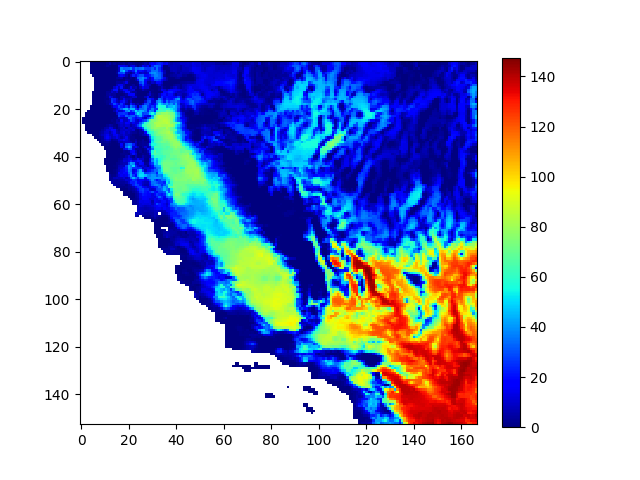
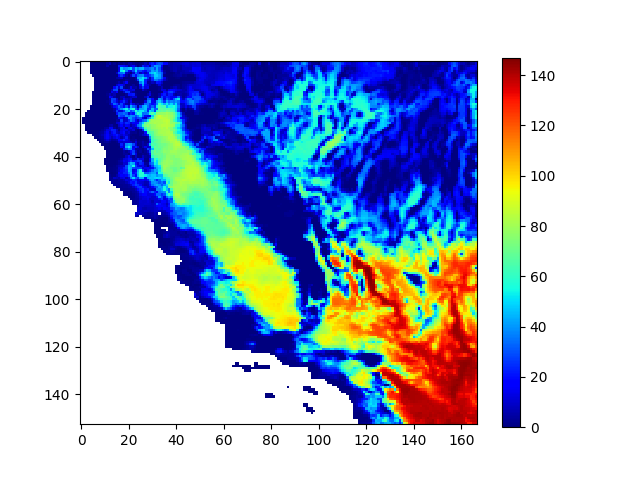
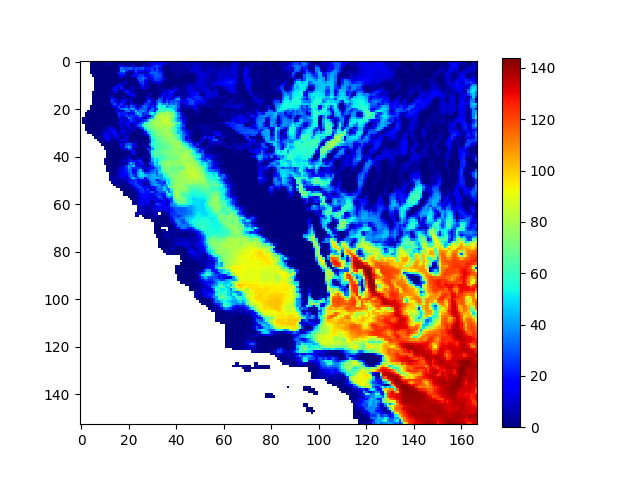
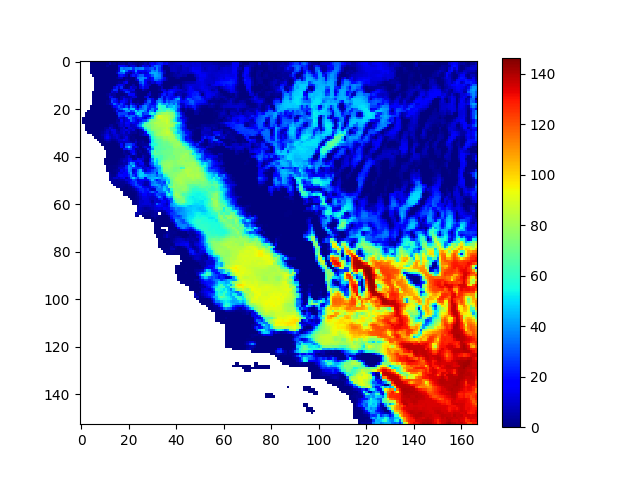
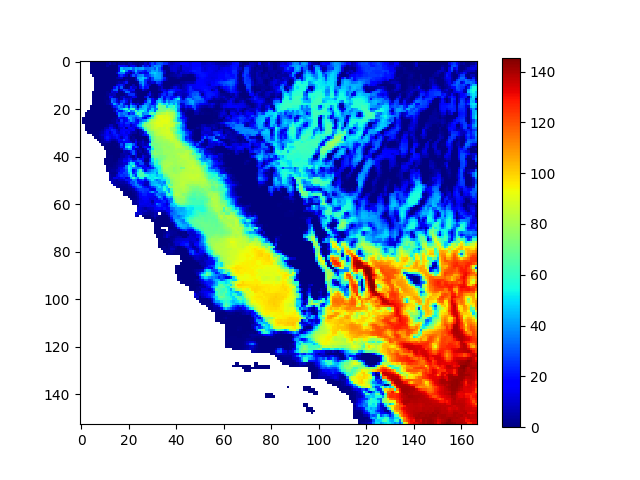
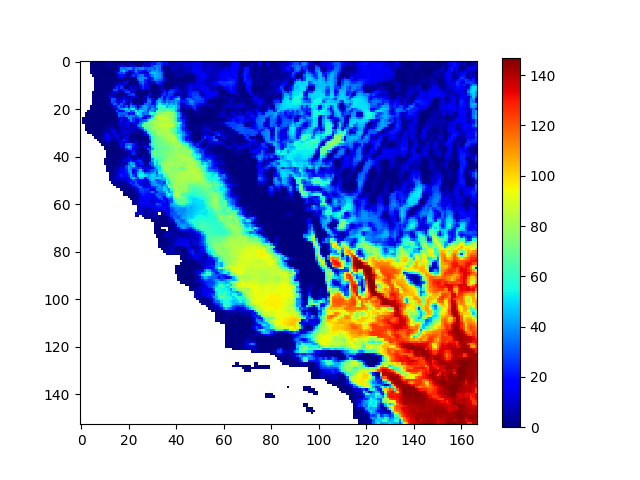
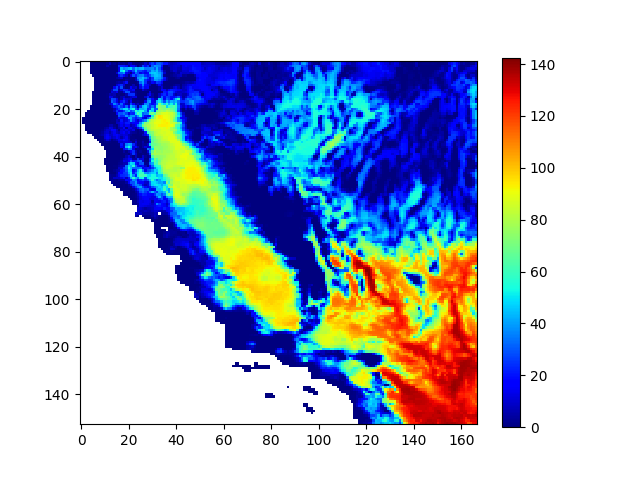
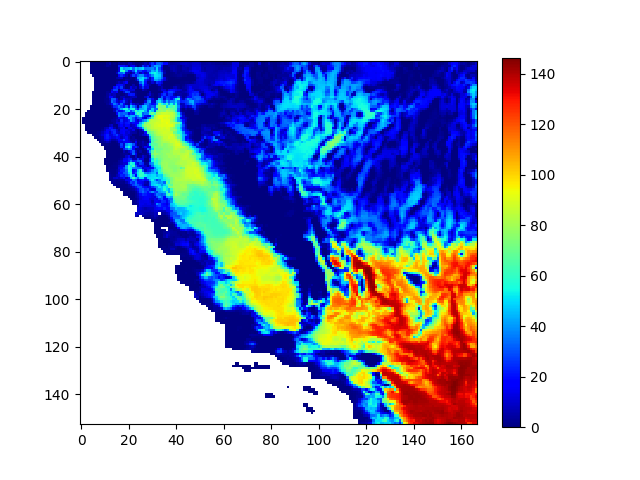
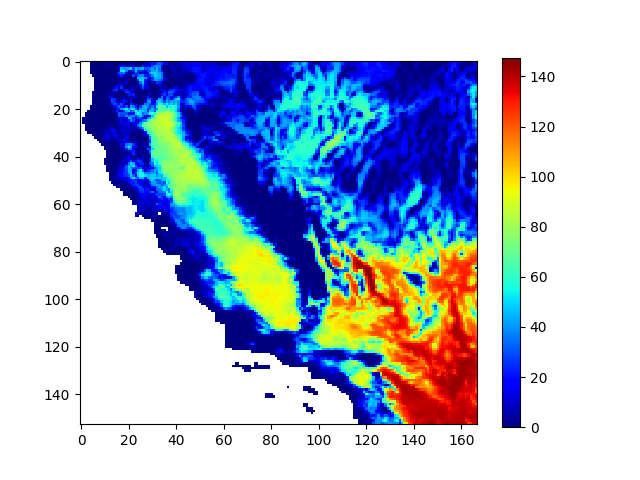
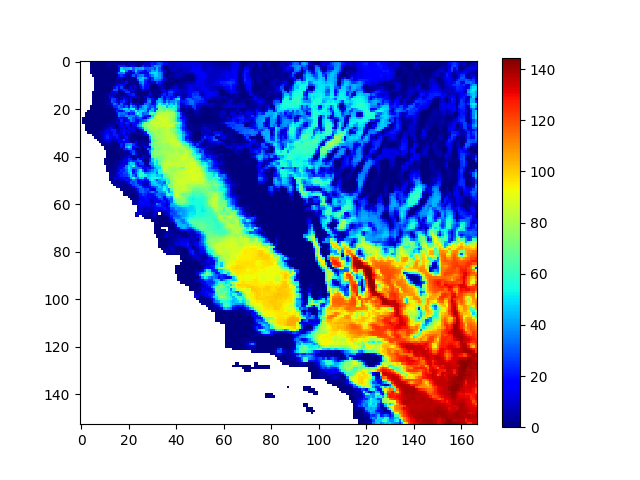
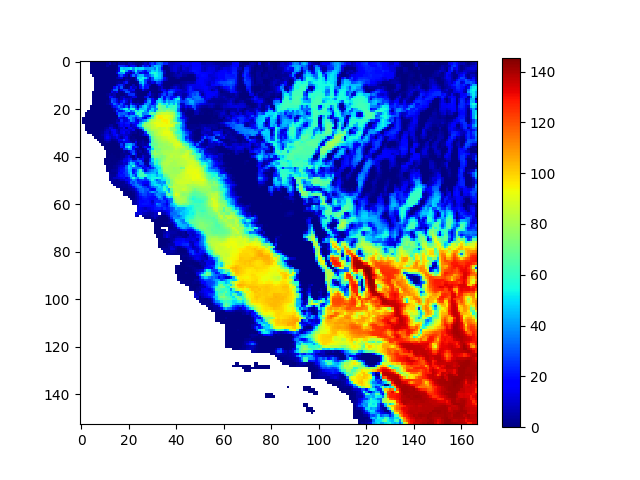
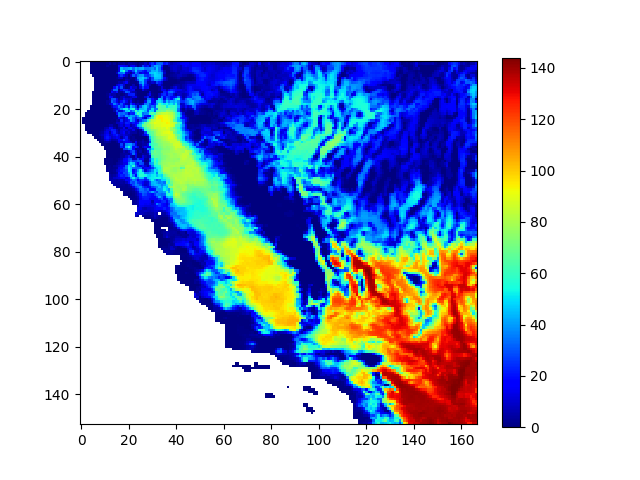
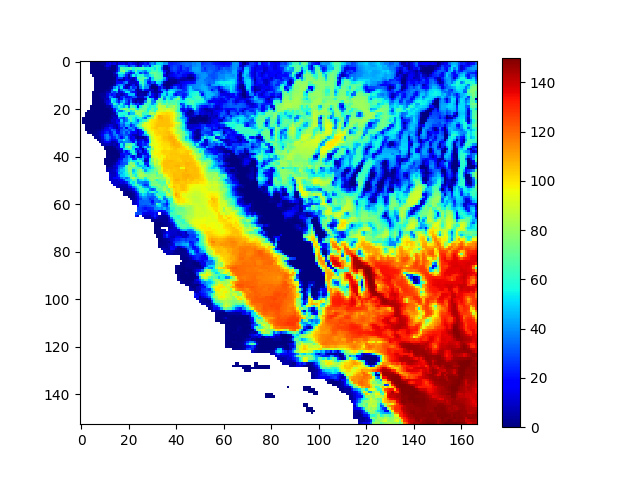
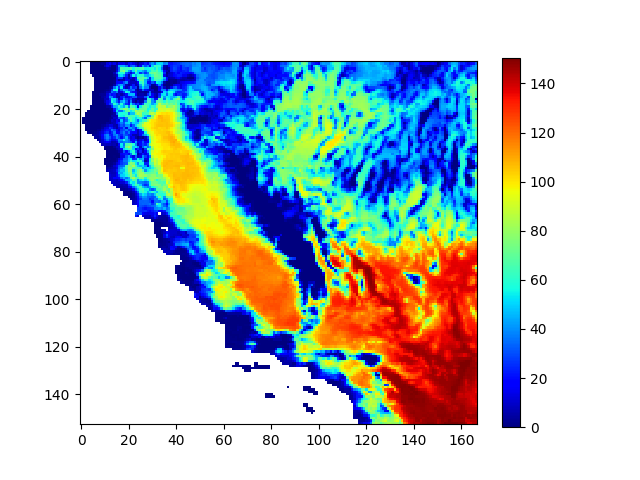
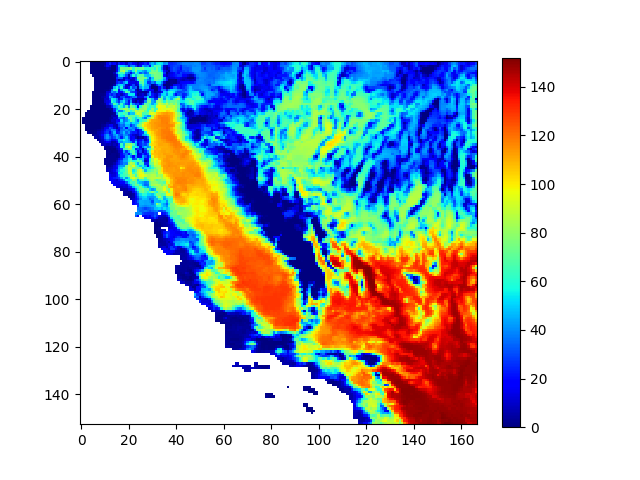
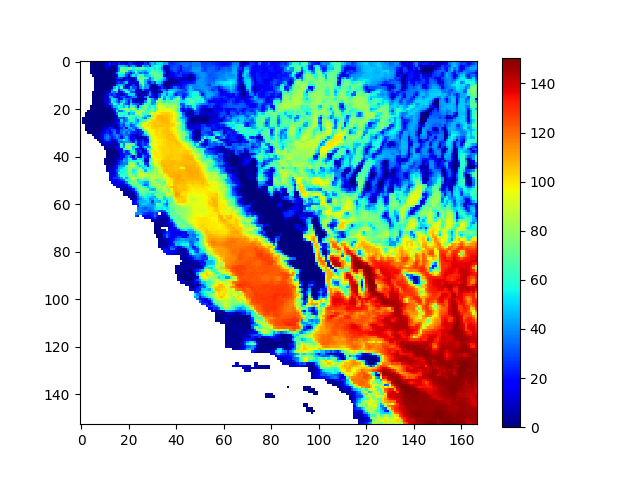
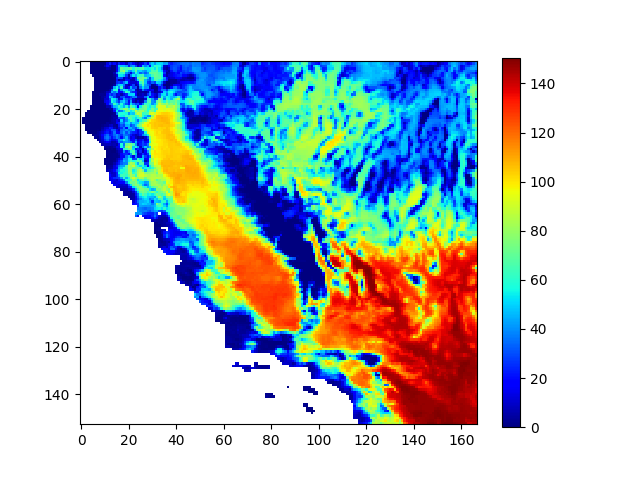
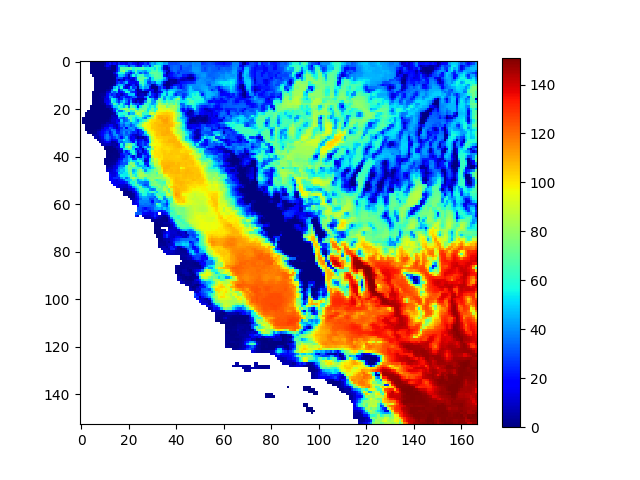
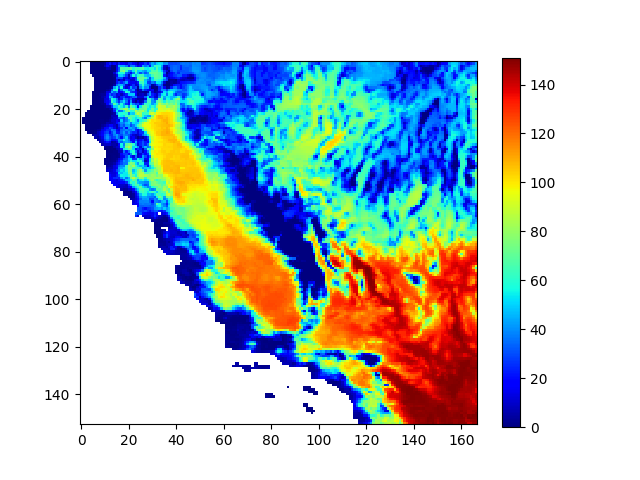
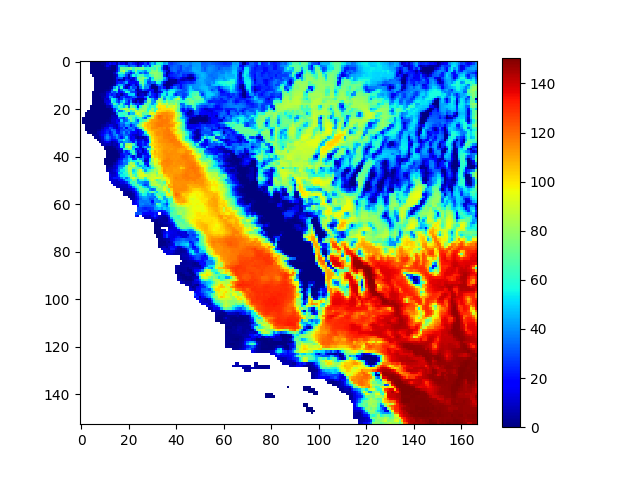
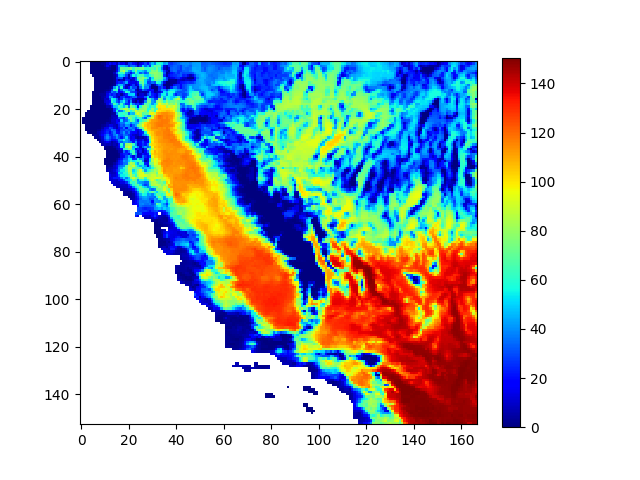
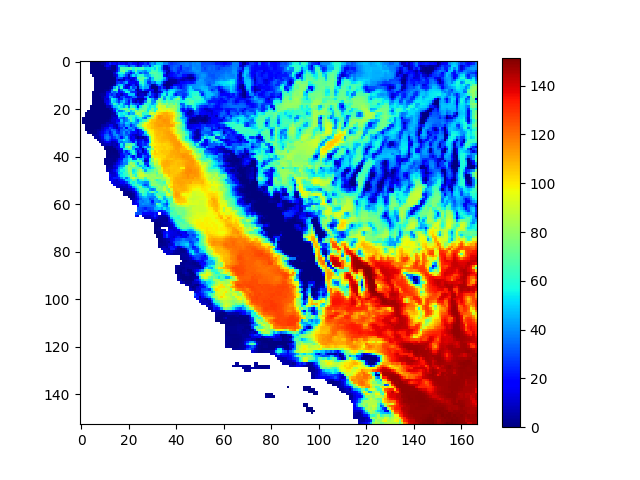
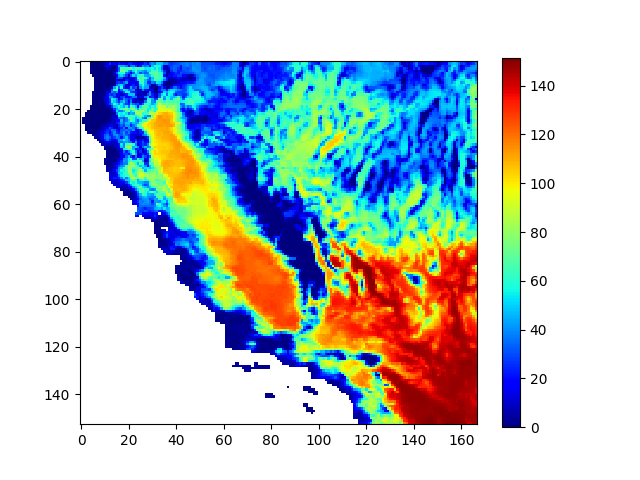
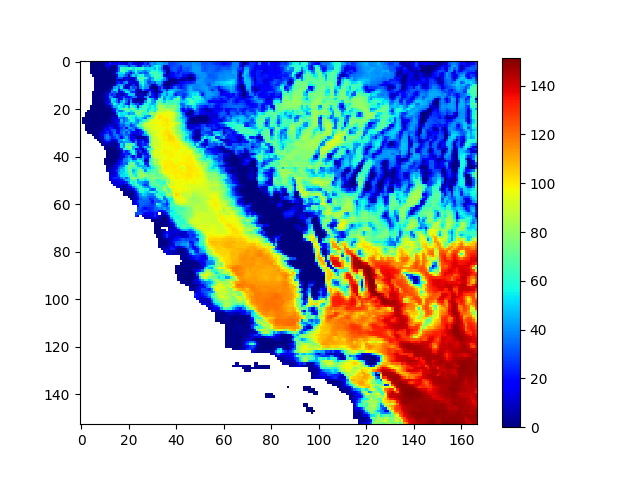
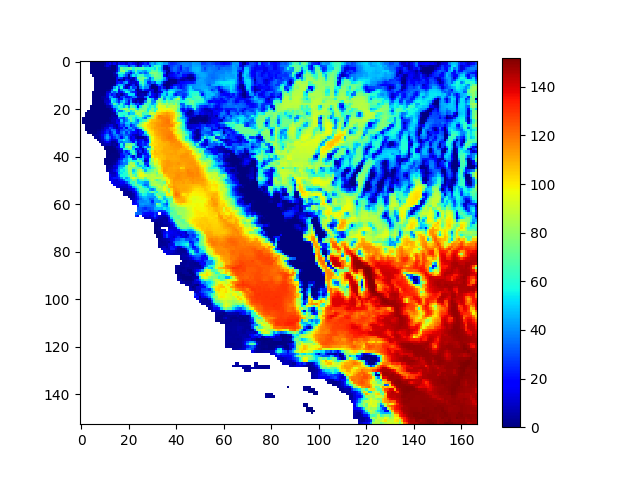
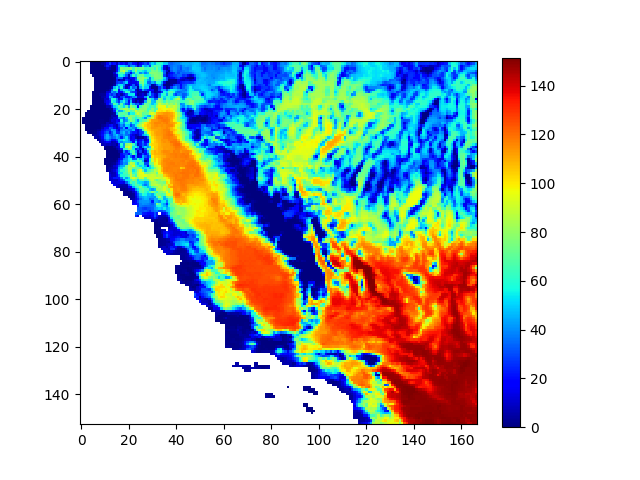
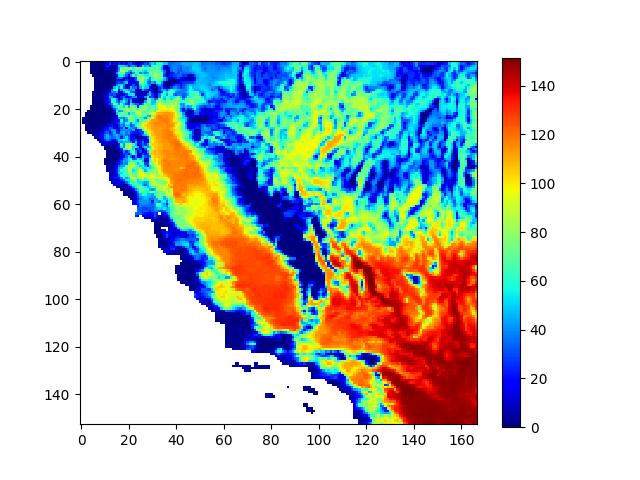
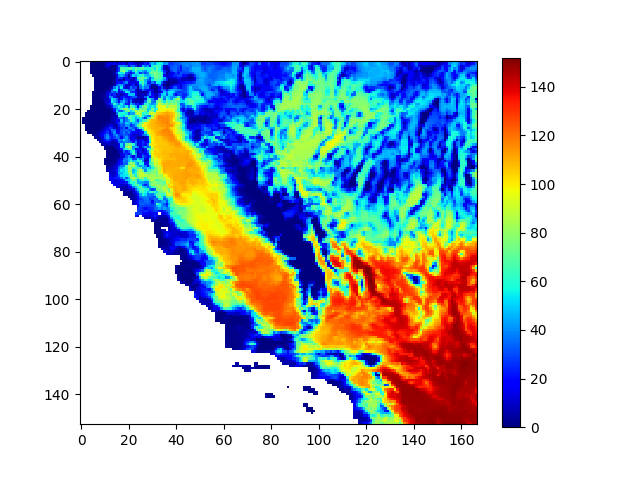
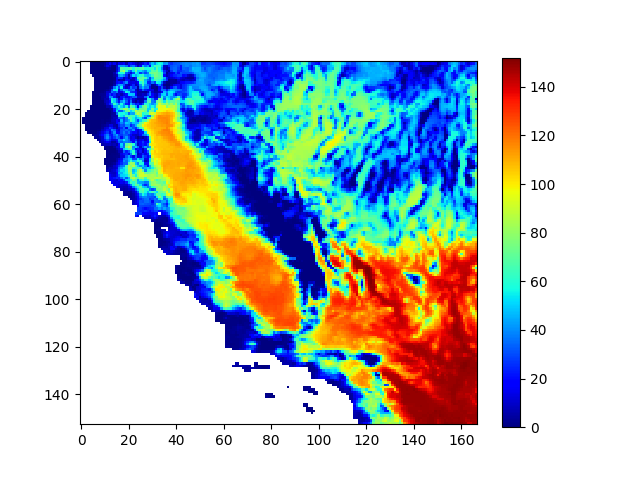
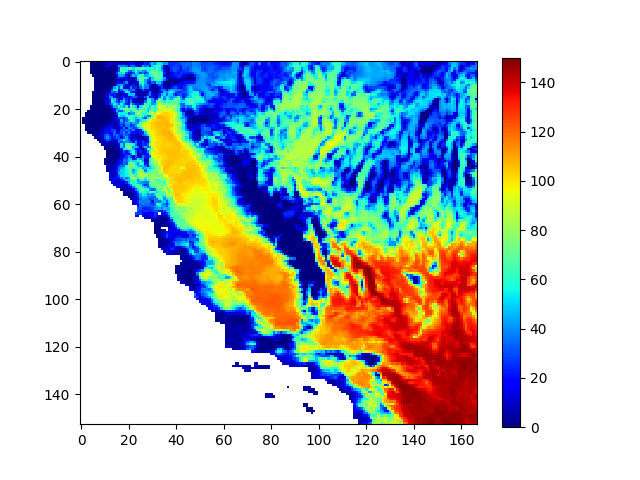
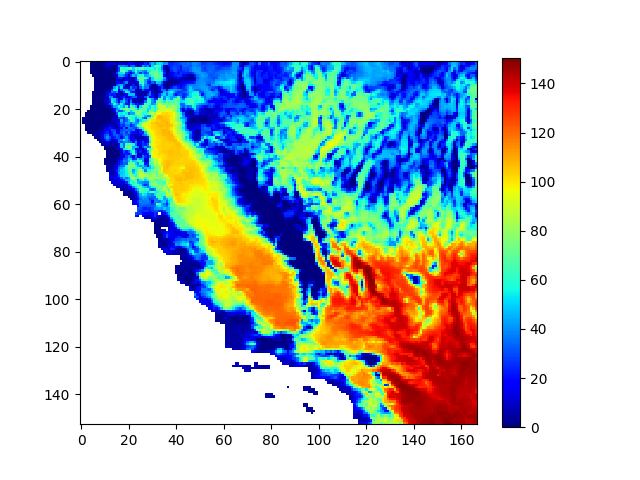
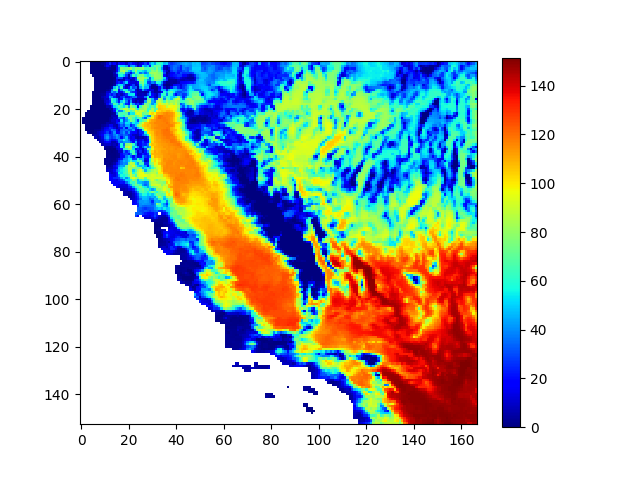
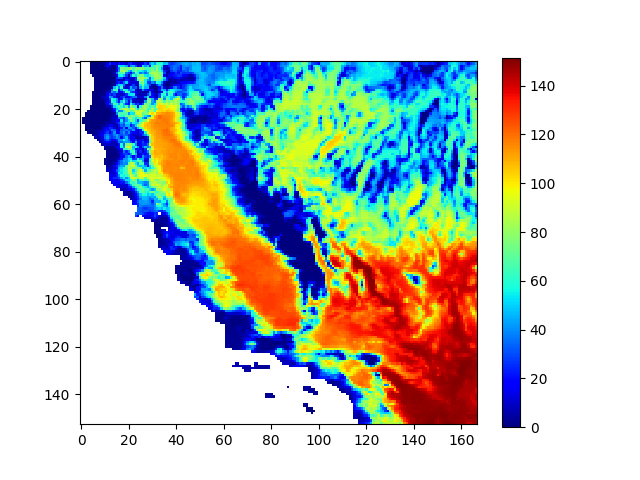
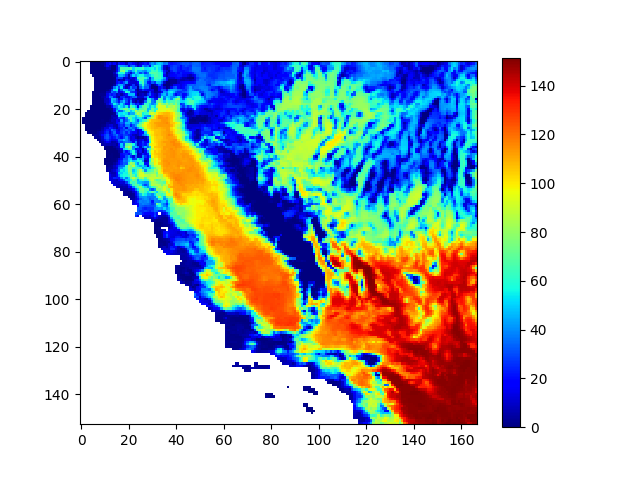
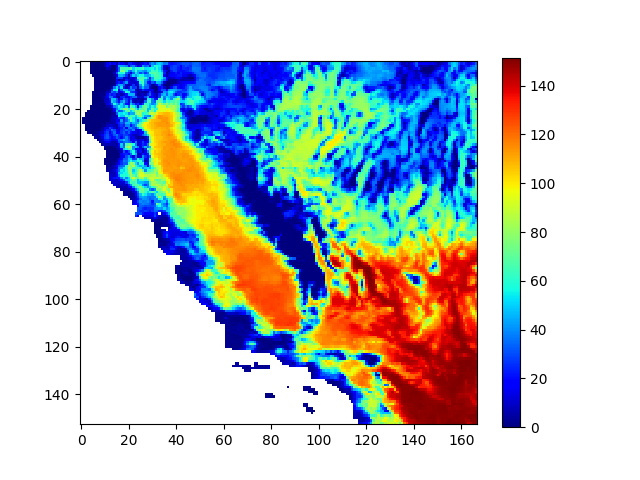
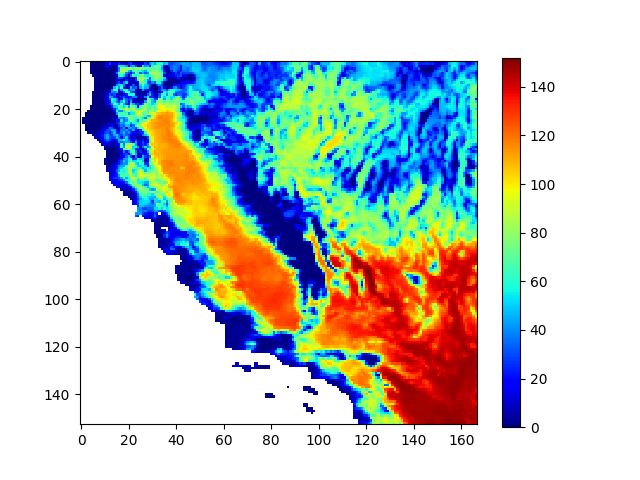
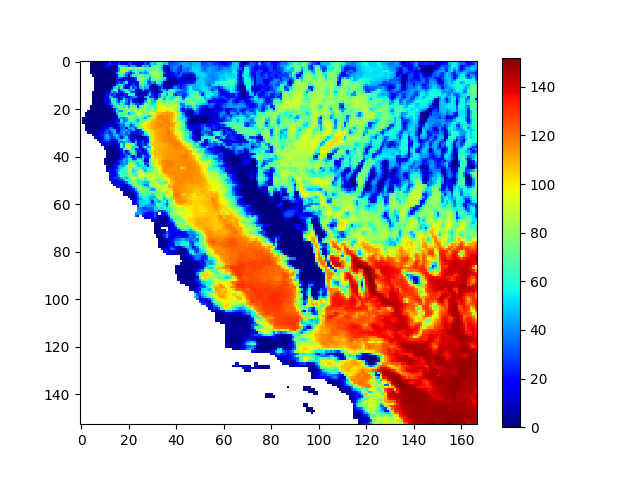
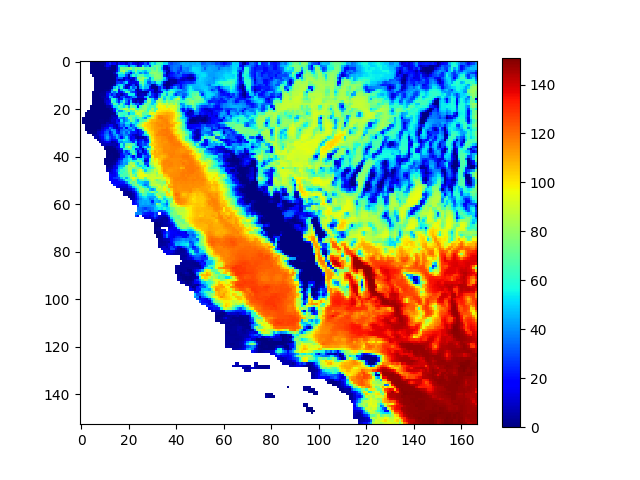
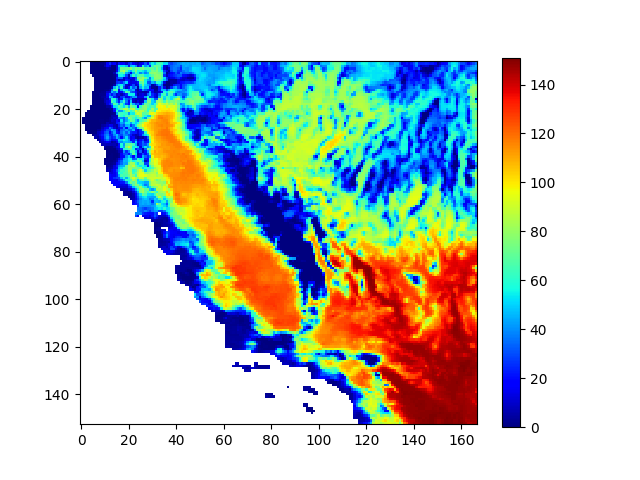
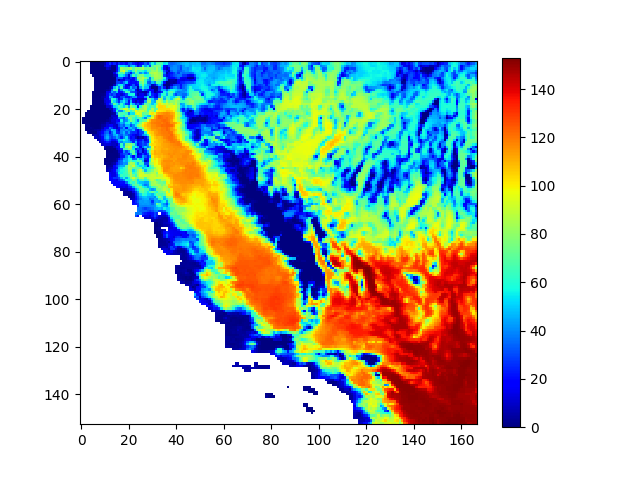
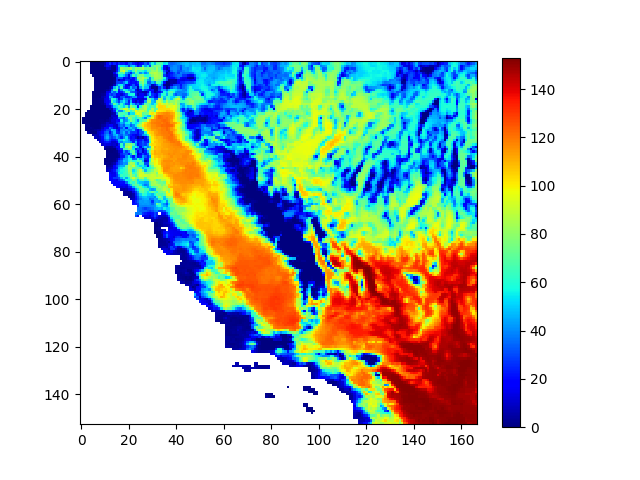
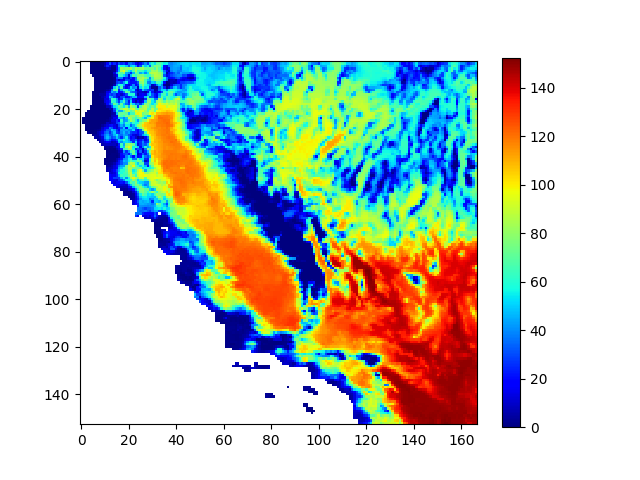
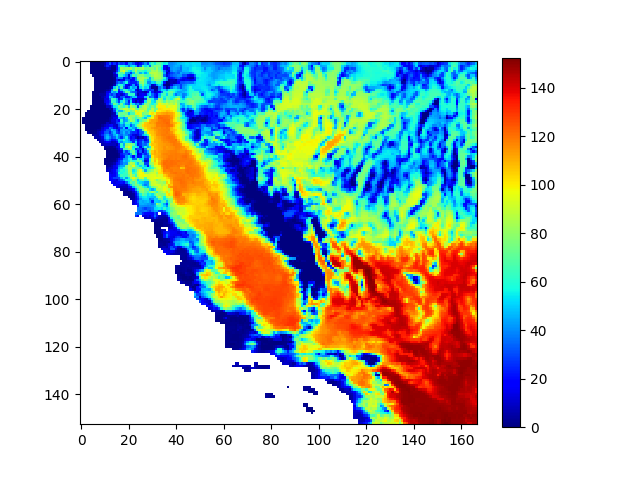
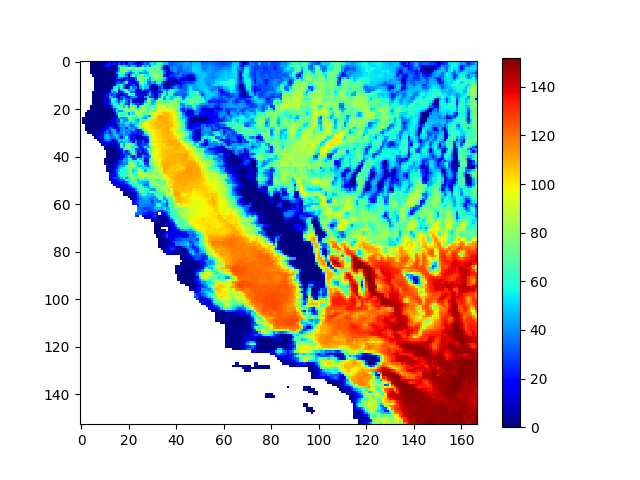
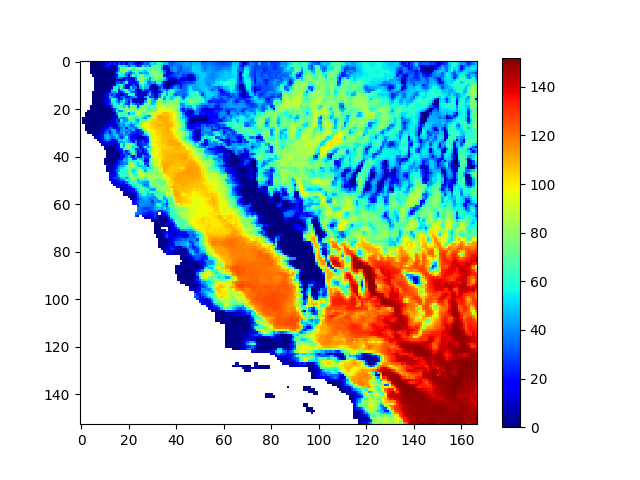
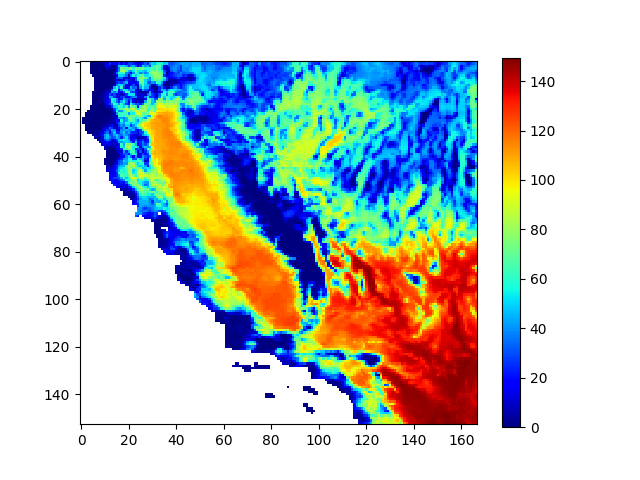
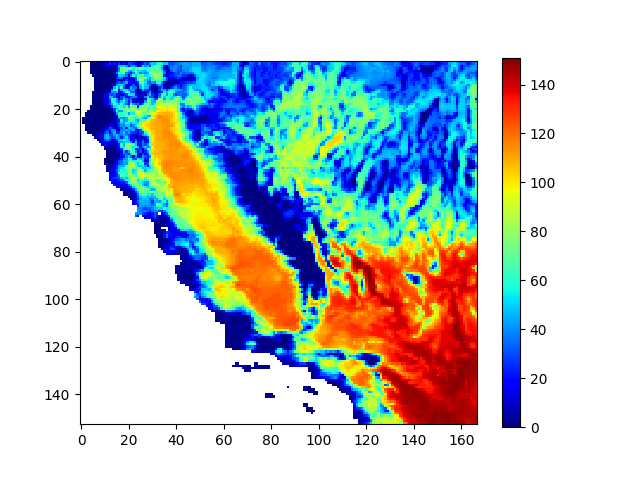
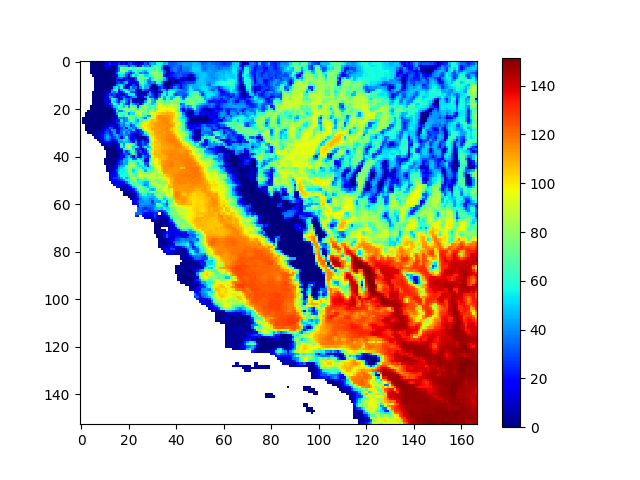
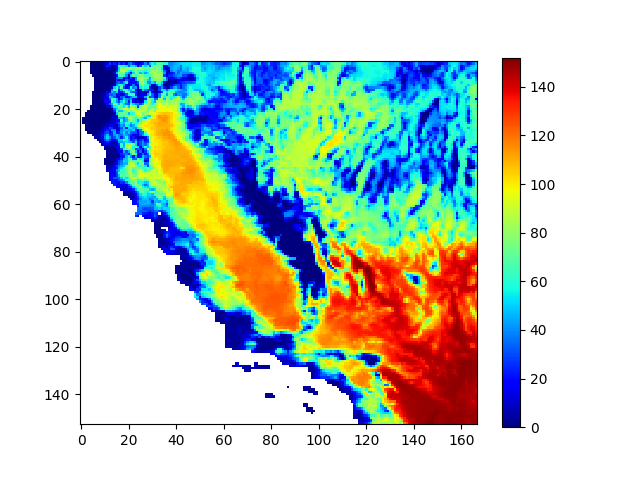
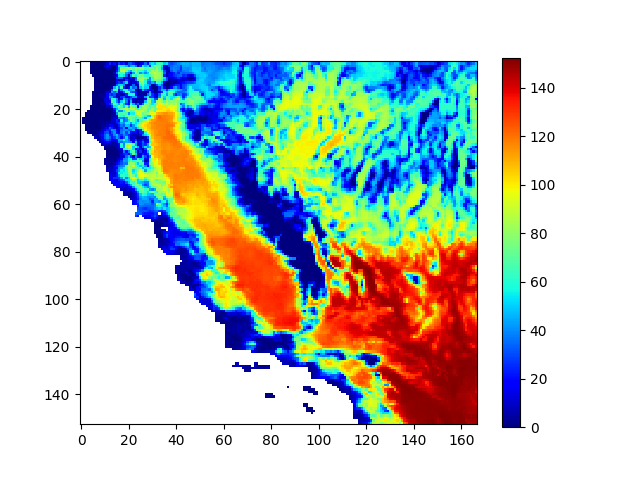
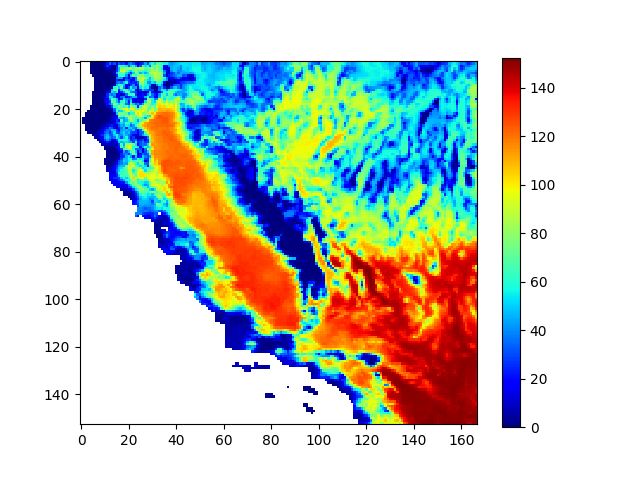
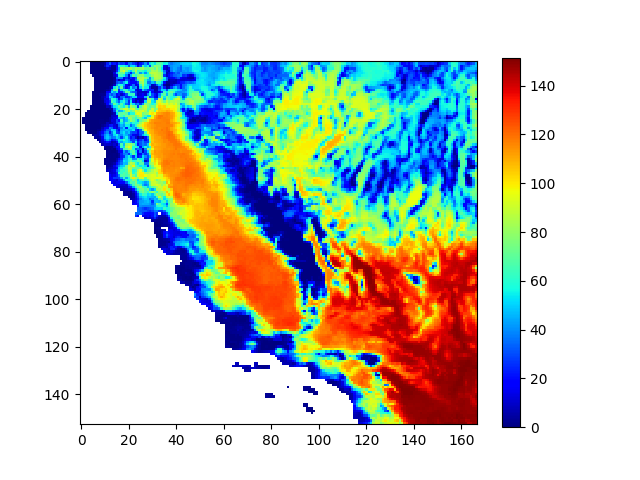
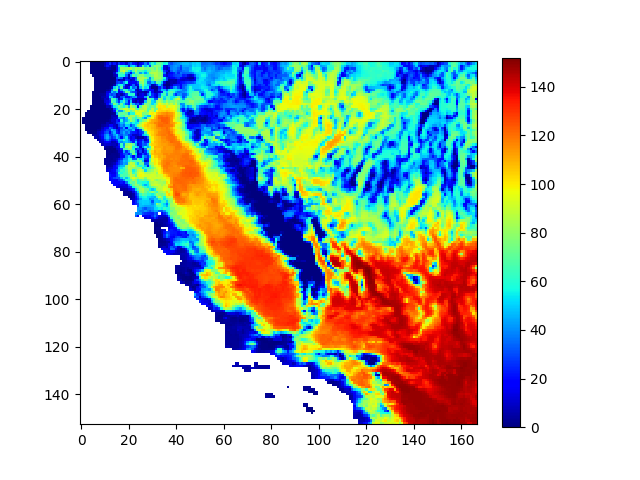
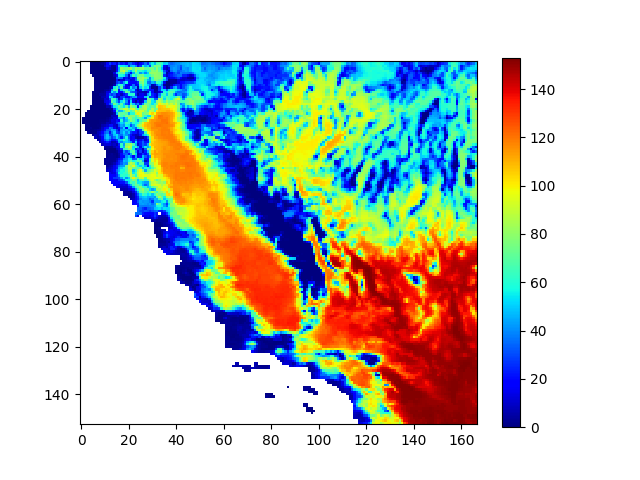
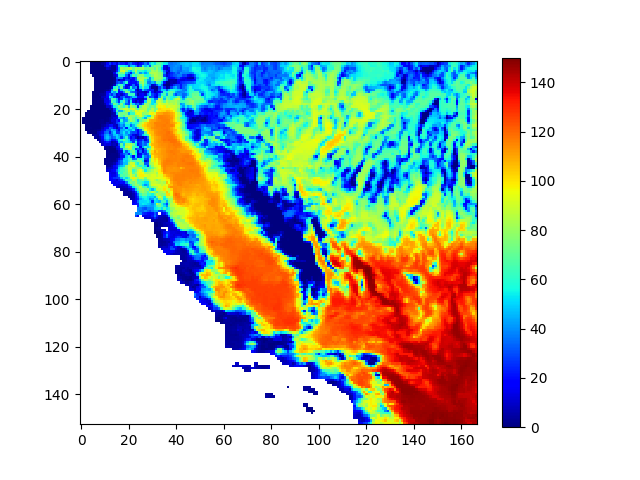
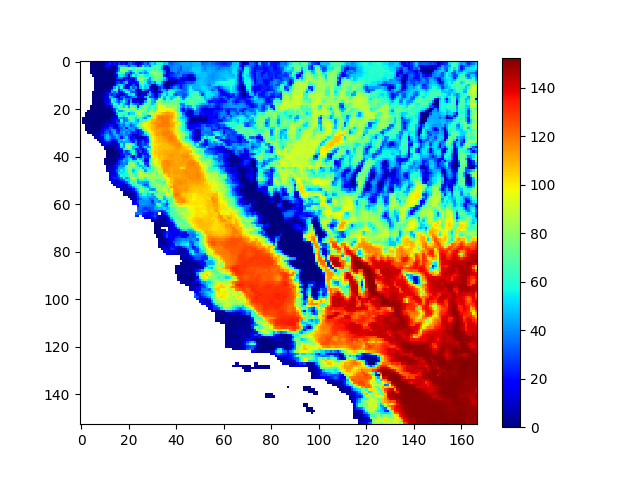
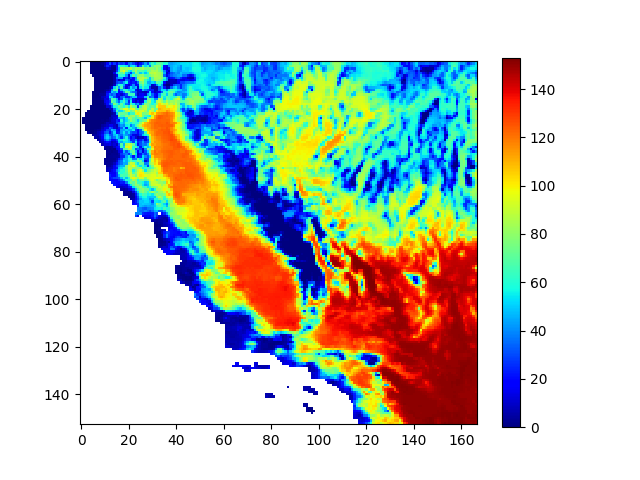
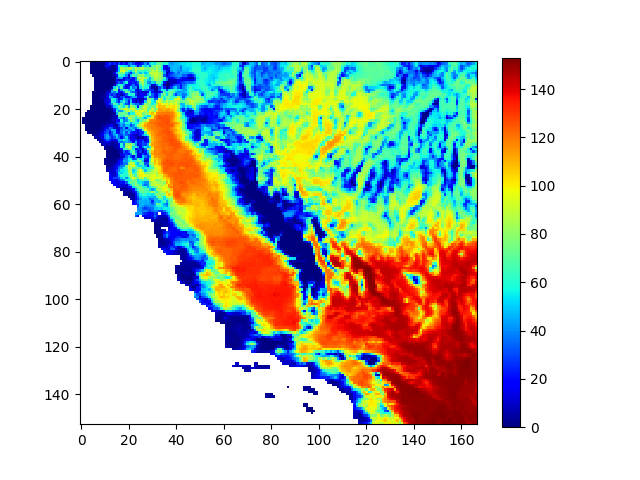
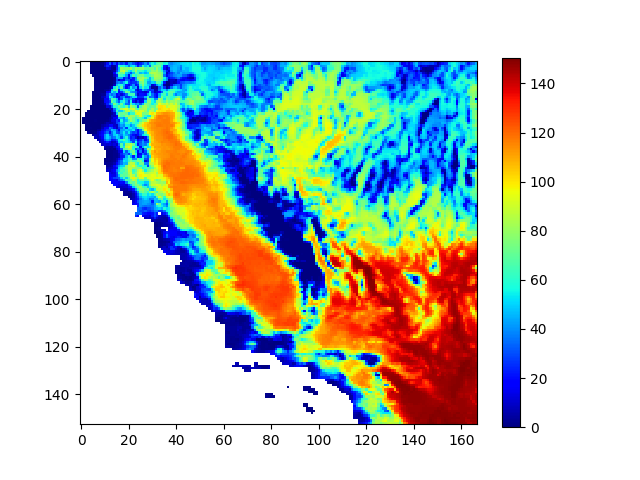
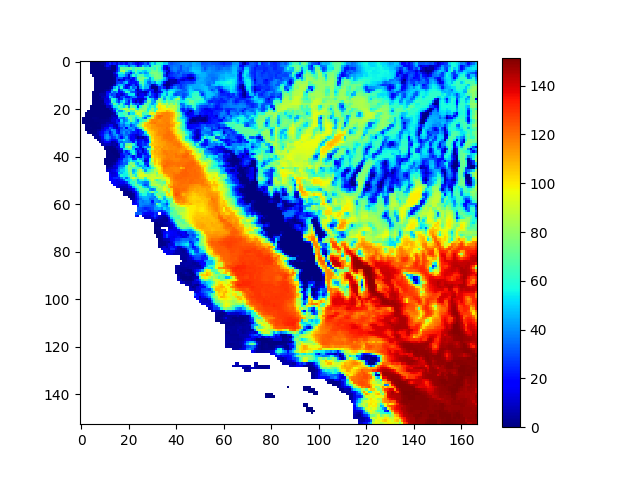
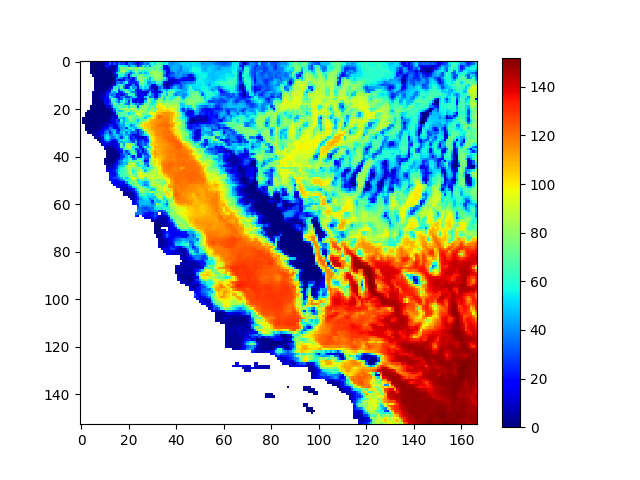
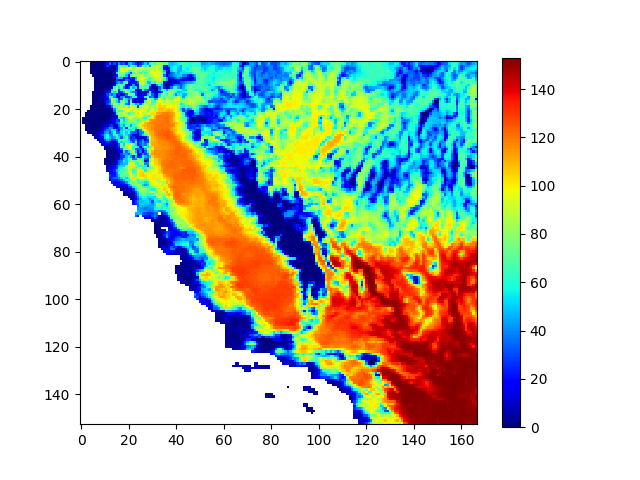
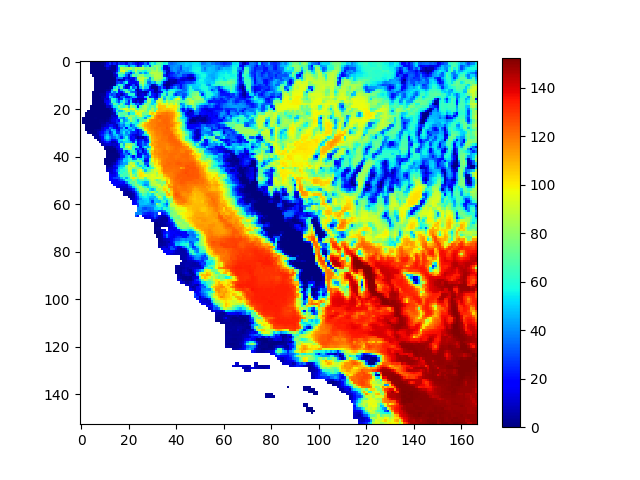
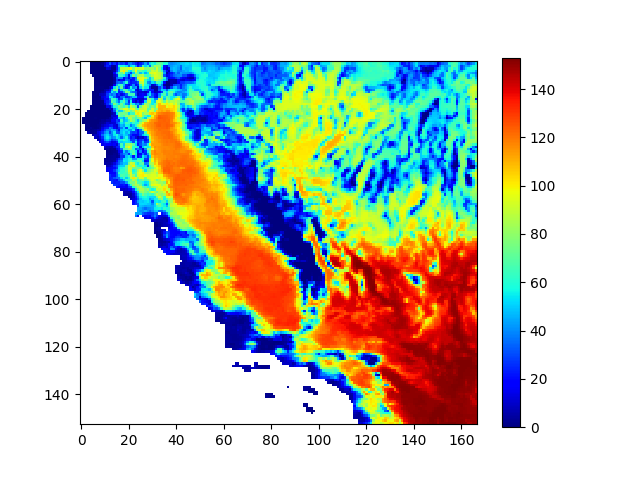
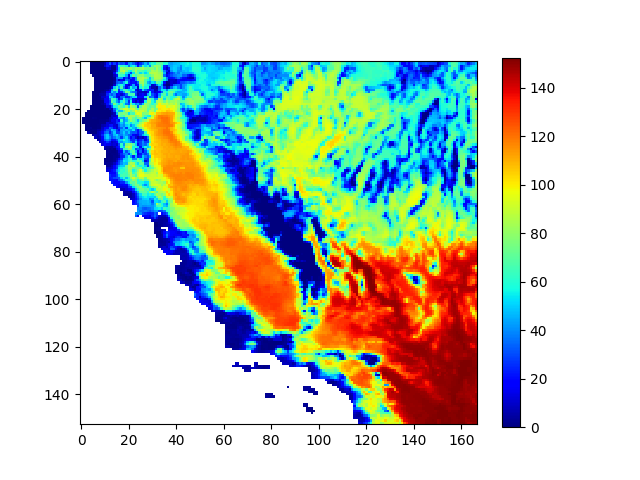
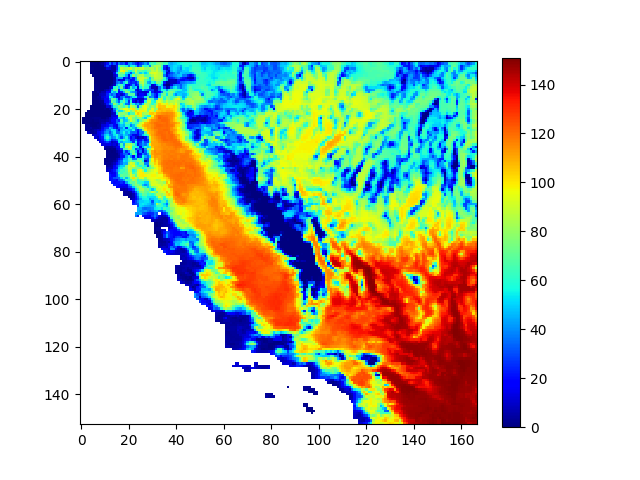
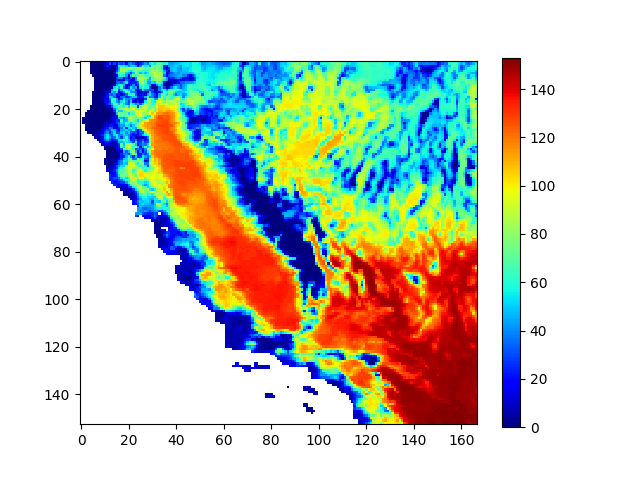
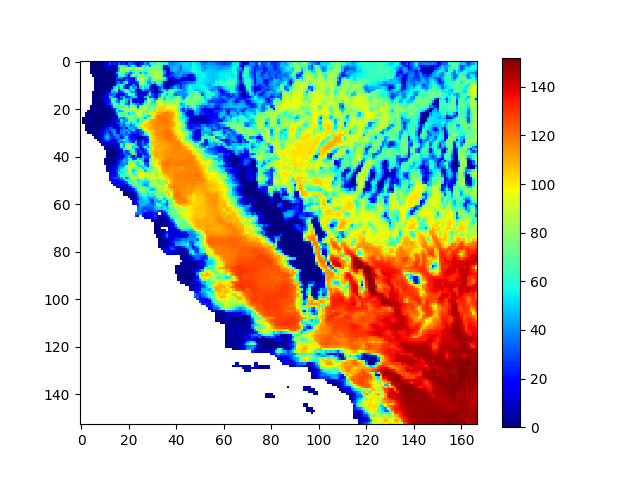
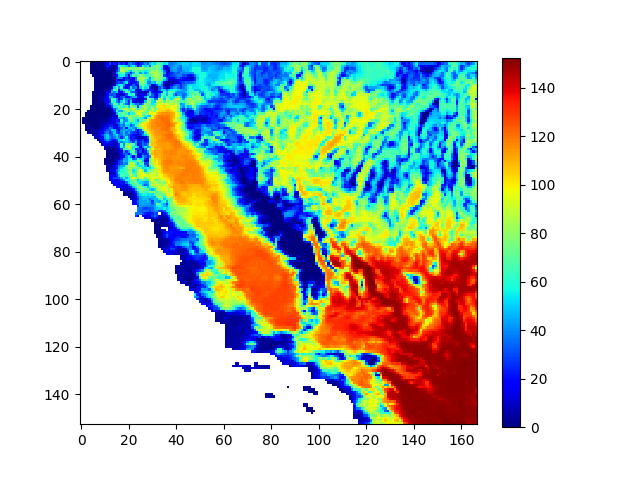
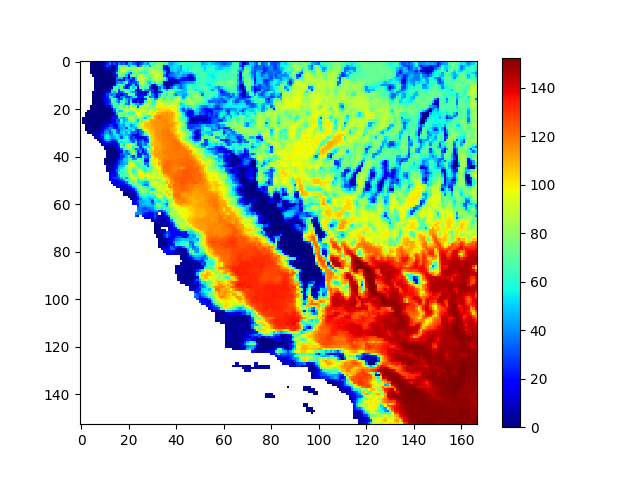
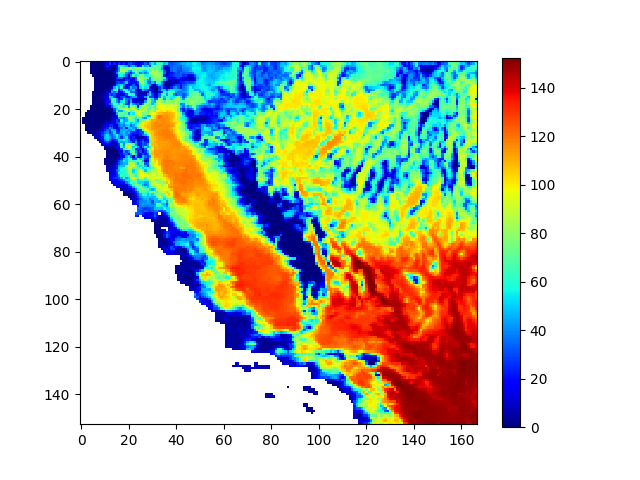
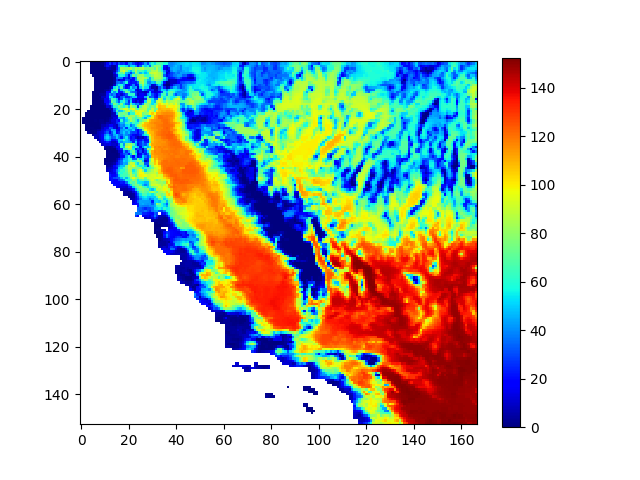
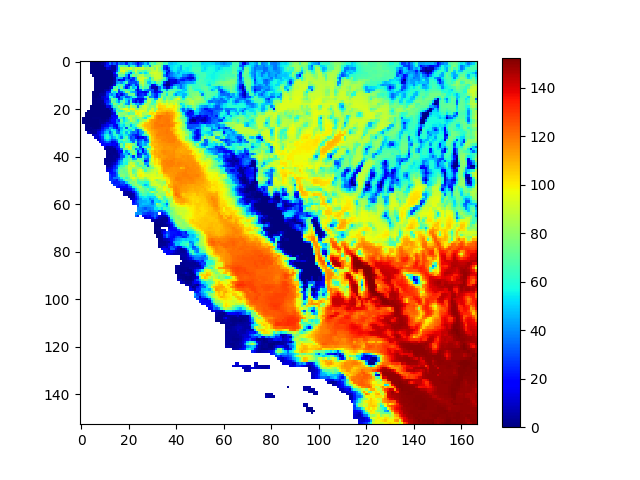
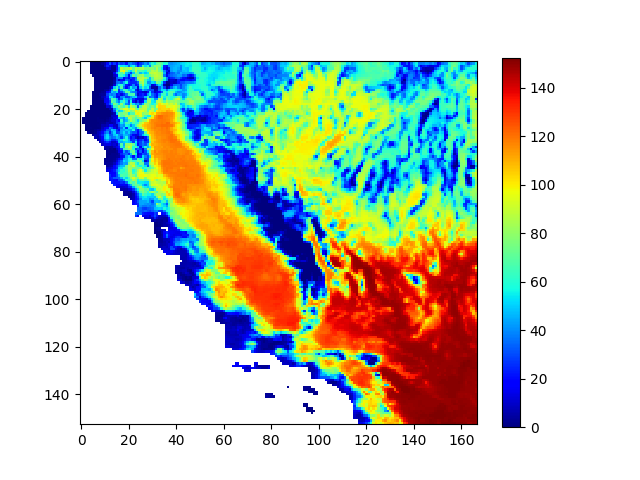
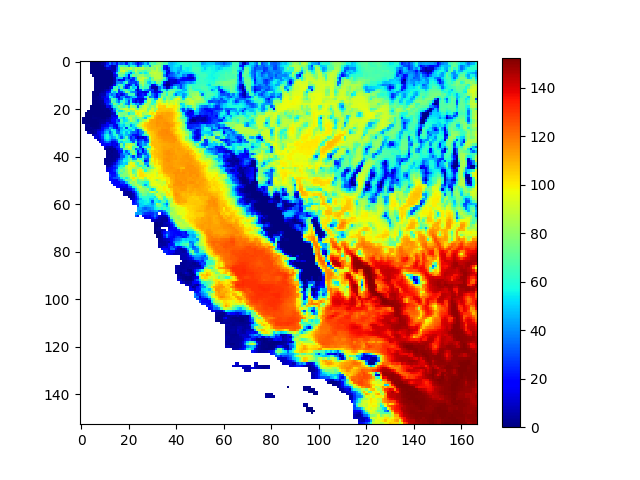
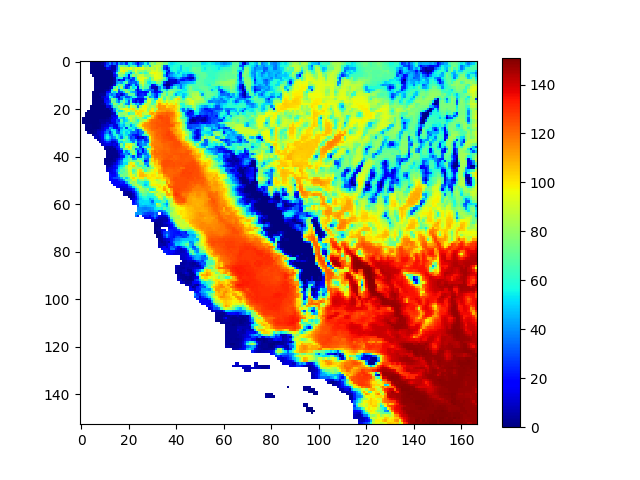
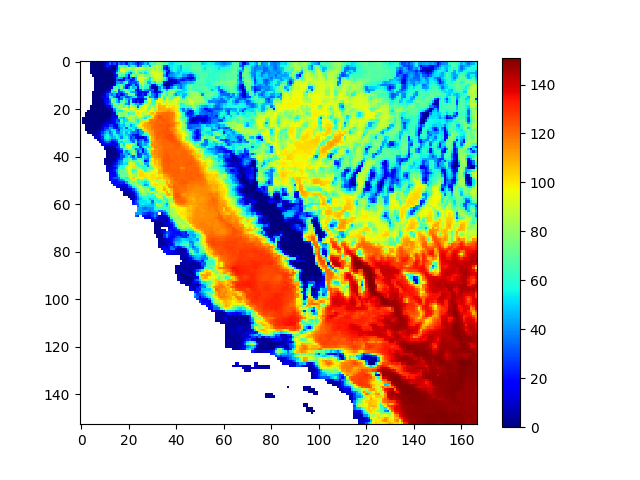
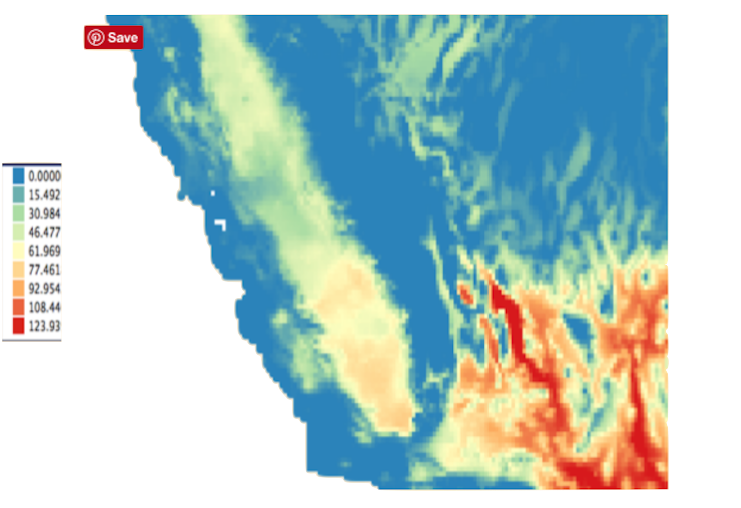
For each of the ten LOCA models we computed the total number of days per season
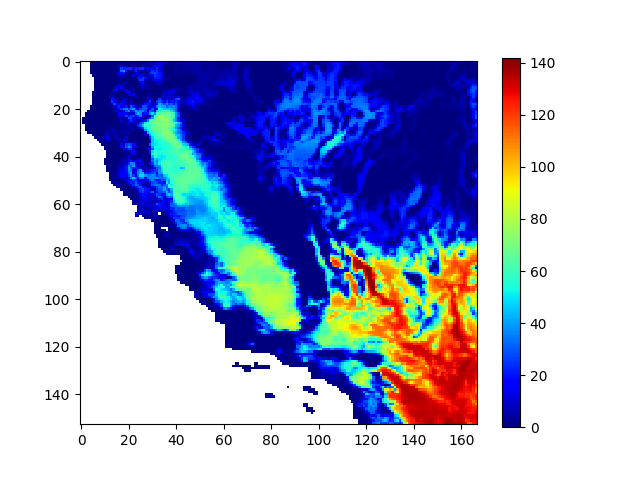
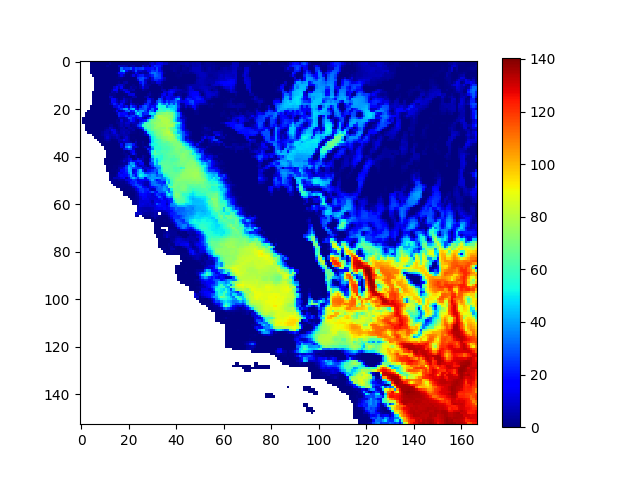
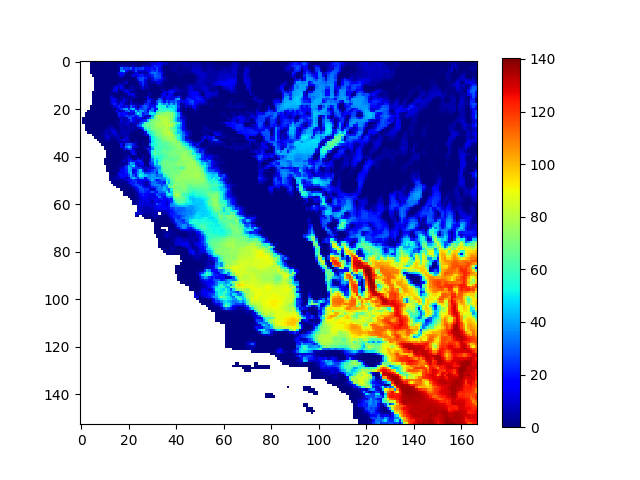
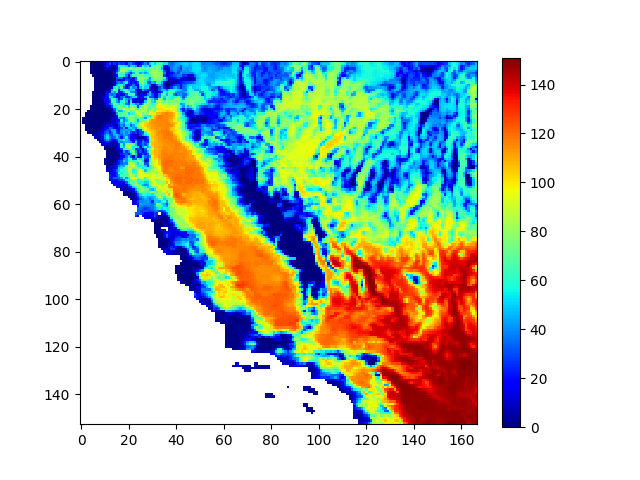
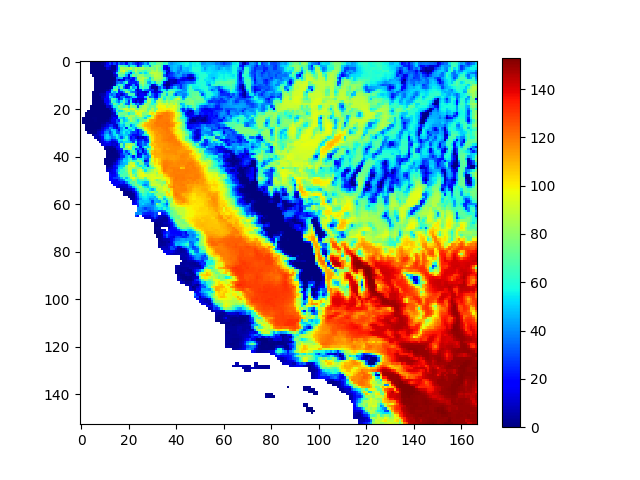
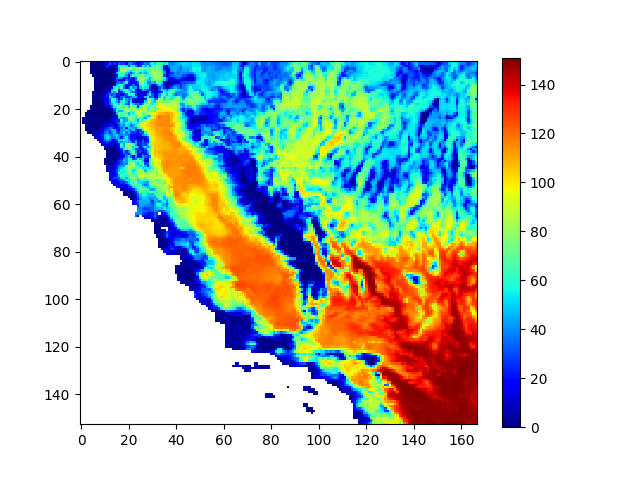
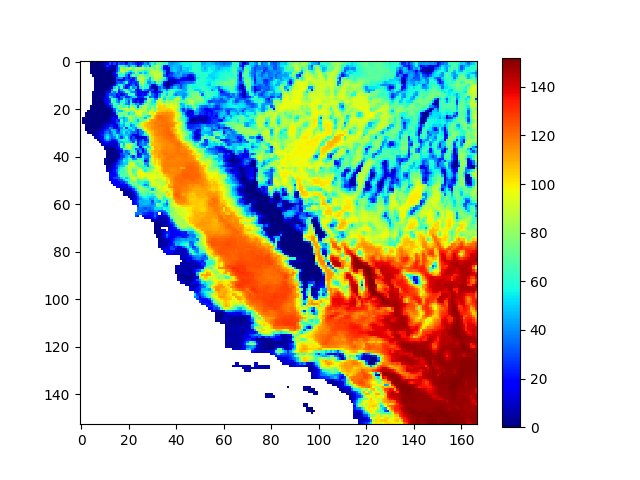
(May - September, inclusive) where the daily maximum temperature exceeds 35.2 Degree Celsius.
We then took the median value of the ten model results at each LOCA grid-point in California.
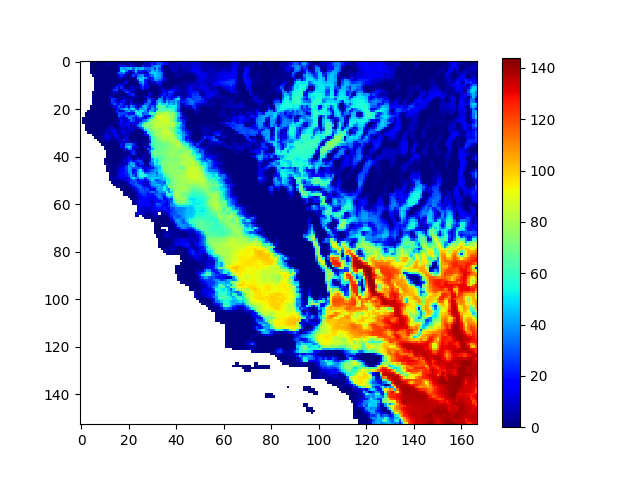
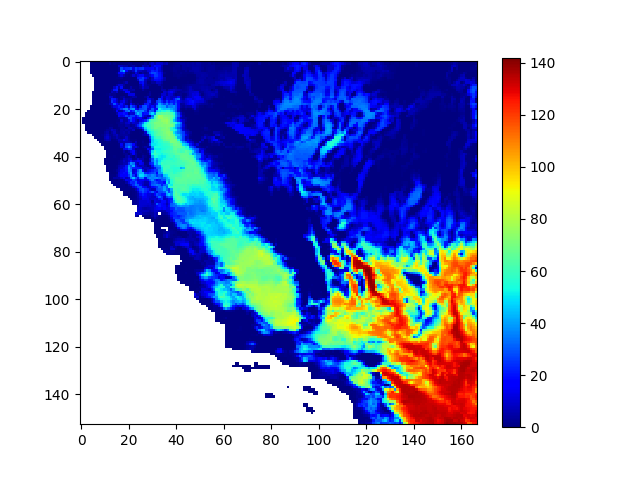
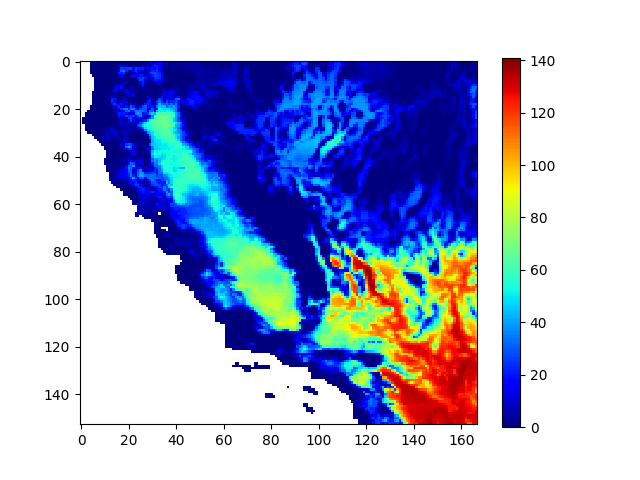
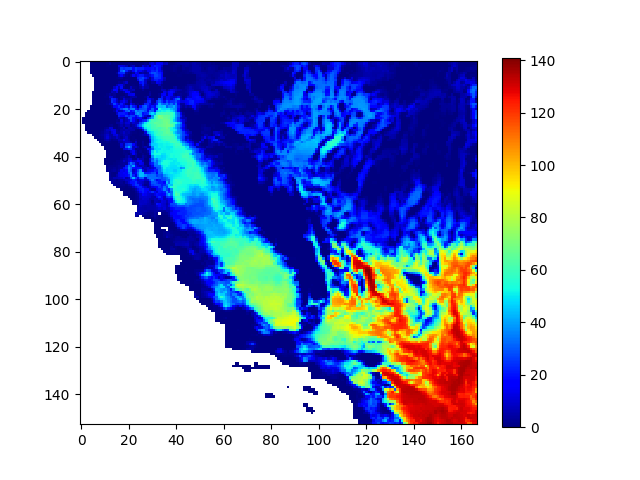
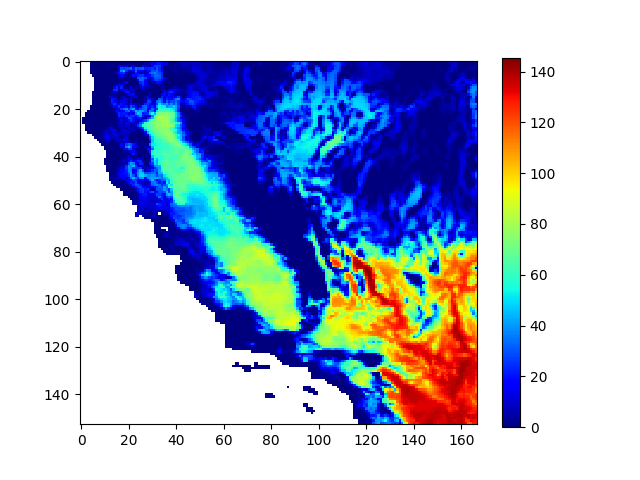
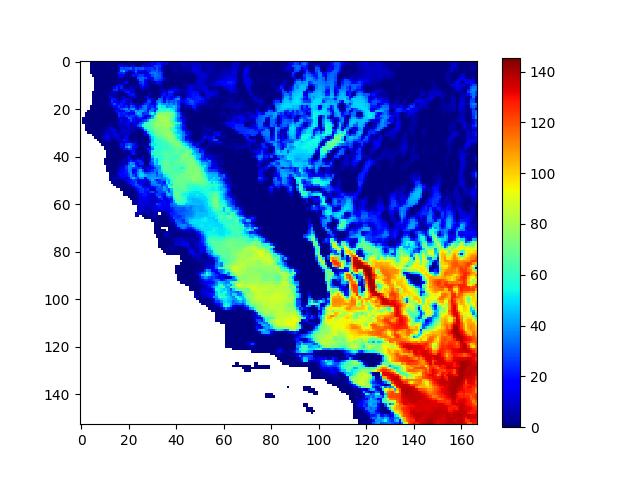
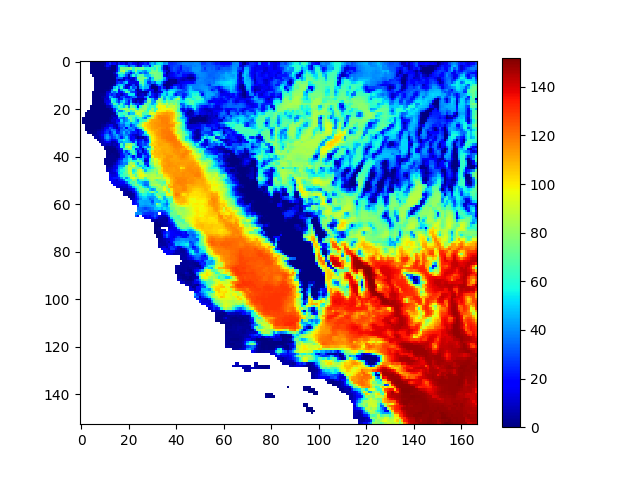
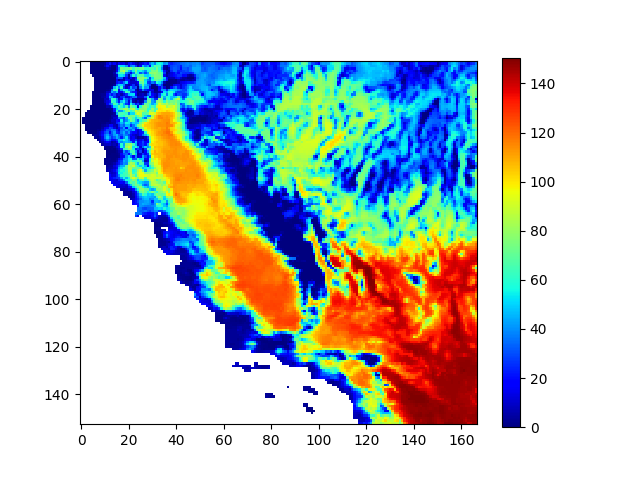
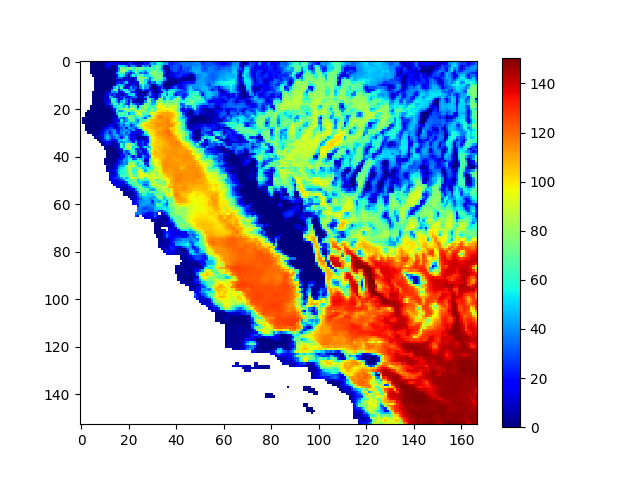
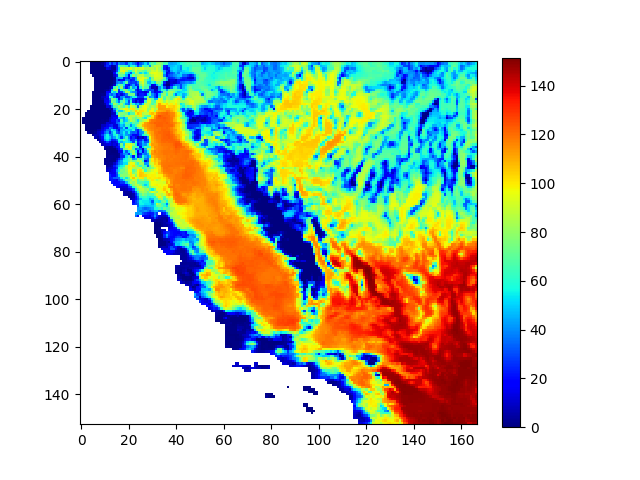
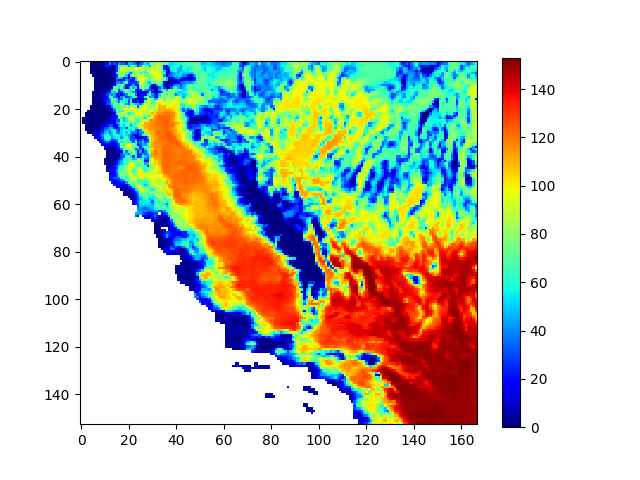
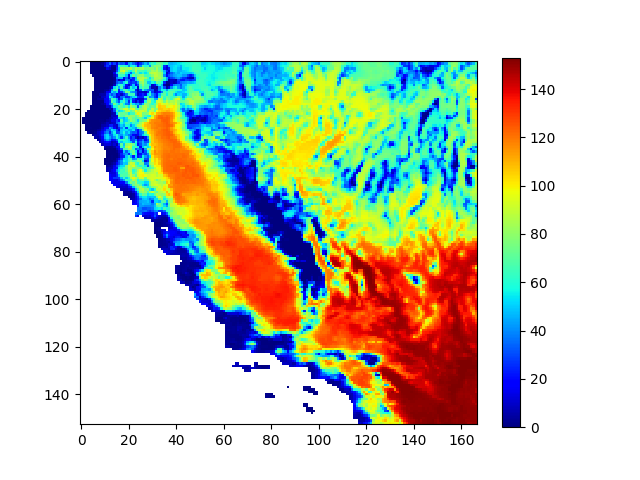
Figure 1: Number of days in the season (May to September 2025) where the daily maximum temperatures exceeed 35.2 Degrees Celsius.
Aim:
To investigate the implications of a changing climate on heat wave probabilities at a high spatial resolution over the geographically and climatically complex Southwest US.
Resource management application:
Description:
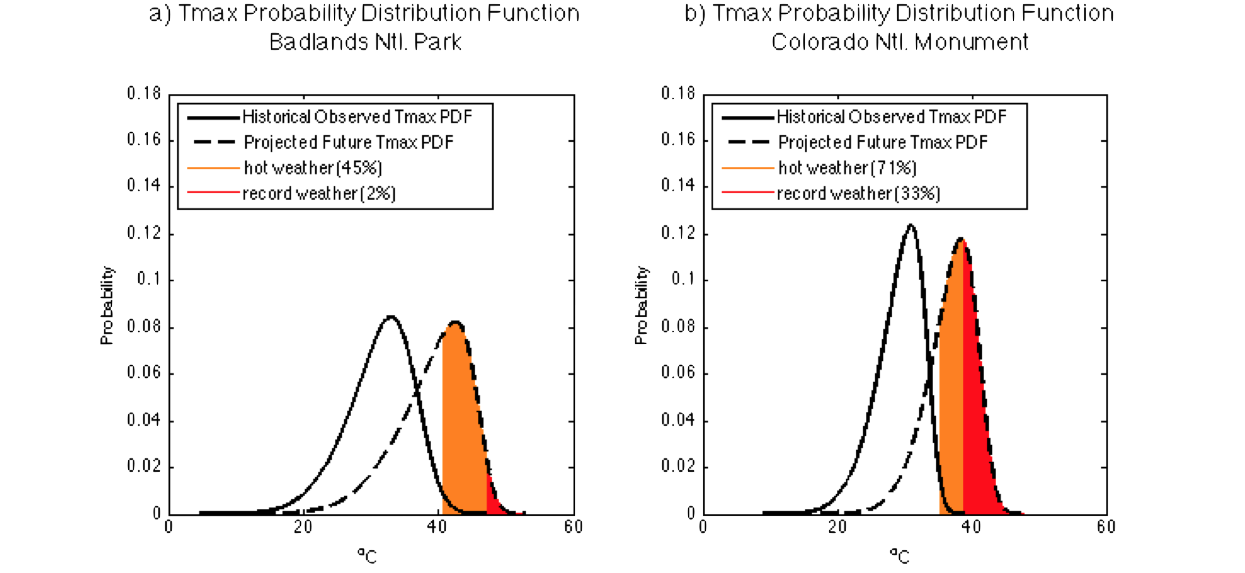
Changes in heat wave probability do not directly follow changes in background warming (Figure 1). Background warming in the Southwest is greatest in the northern part of the domain (Figure 1a), however, the largest increases in heat wave probability occurs in the central part of the domain (Figure 1b). This is because temperature PDFs in the Southwest US are non-Gaussian and asymmetric with shapes that vary considerably across the region. Locations with shorter warm tails would see a greater increase in heat wave probability than would locations having longer warm tails under the same amount of warming. Additionally, subtle changes in the PDF shape can also affect future heat wave probabilities. Badlands National Park (BNP) in South Dakota, for example, is projected to experience a larger increase in daily maximum temperatures than is projected for the Colorado National Monument (CNM). Specifically, a 7.6 °C shift in central tendency is projected for BNP versus 4.4 °C for CNM. In terms of heat wave probability, however, CNM is projected to experience more heat waves. Both the BNP and CNM distributions are negatively skewed, but the temperature PDF at CNM has shorter warm tails and a smaller variance. Shifting distributions with shorter warm tails results in a larger increase in heat wave probability because the higher density portion of the PDF curve is closer to the historical 95th percentile threshold (Figure 2). At CNM, 71% of summer days are projected to exceed the historical heat wave threshold, compared to 45% for BNP. Similarly, for record heat, projections for CNM show record temperatures occurring on 33% of days compared to 2% for BNP.
Methods:
To study the relationships between background warming and heat wave probability, we first define a heat wave locally at each grid cell as days when temperatures exceed the historical (1961-1990) 95th percentile. Next, we fit skew-normal probability distribution functions (PDF) to summer (June-August) daily maximum temperature (Tmax) data from historical simulations and future projections from ten LOCA downscaled CMIP5 models. Background warming is defined as the shift in the temperature PDF measured as the change in the central tendency (or mode). It is more common to see the background warming described in terms of a change in the mean. However, the mean can be unduly influenced by outliers, therefore the mode is a more precise measure. For this analysis, we first computed the background warming (change in mode) projected for the end of the 21st century (Figure 1a). Next we computed future heat wave probabilities defined as the probability of exceeding the historical (1961-1990) 95th percentile threshold (Figure 1b). For this analysis we used the end of the 21st Century (2070-2099) projections run under the RCP8.5 “business as usual” greenhouse gas emissions scenario.
Figure 1:
Panel (a) shows the background warming in the Southwest US measured as the change in the central tendency (mode) of the daily temperature PDF. Panel (b) shows the local heat wave probability by the end of the 21st century. These results are based on the average of ten LOCA downscaled CMIP5 models.
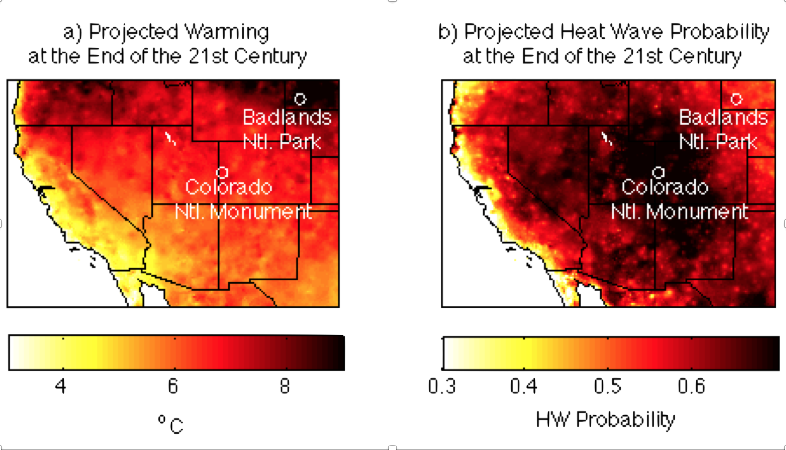
Figure 2:
Example showing two locations in the Southwest US that have different temperature PDFs. Background warming is greater at Badlands National Park than at Colorado National Monument. However, future heat wave probability is projected to be greater at Colorado National Monument because of the shorter warm tails and smaller variance there. Hot weather (orange) represents temperatures above the historical 95th percentile (heat waves) and record weather (red) represents temperatures not previously encountered. Both locations additionally experience a change in PDF shape on top of the background warming. The historical and projected temperature PDFs are based on the average from the ten LOCA downscaled CMIP5 models.
Aim:
To investigate the implications of a changing climate on California Spotted Owl habitat in the Central Sierra Province.
Resource management application:
The US Forest Service and others involved in natural resource management are interested in identifying climate extremes relative to thermal tolerances of individual species that are targets of management. For spotted owls, at temperatures above 35.2˚C the resting metabolic rate increases substantially and behavioral responses to heat stress have been observed at temperatures from 30–34˚C.
Description:
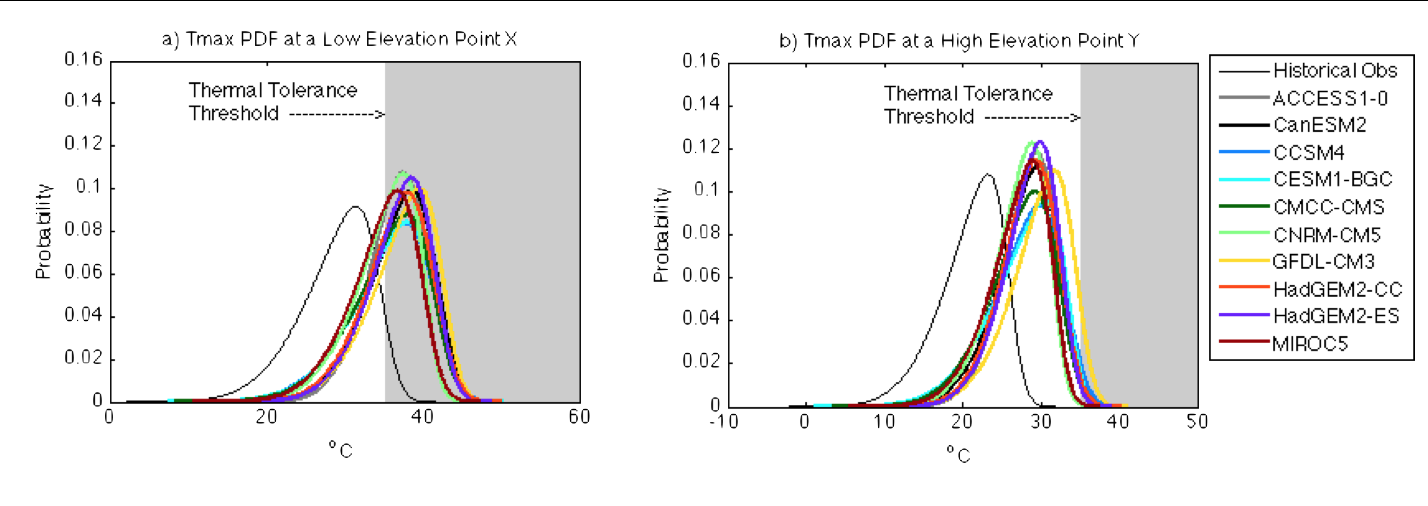
The elevation within the spotted owl territory is highly variable (Figure 1) and therefore temperatures vary dramatically within relatively close spatial distances (Figure 2a). Historically, average summer daytime temperatures occurred in the range of 19-32°C depending on location. By the end of the 21st century these are projected to reach 25-39°C (Figure 2b). Considering the full distribution of the daily temperature probability functions (Figure 3), we find that the lower elevations will exceed the critical threshold for the majority of summer days. For example, at low-elevation point X the critical threshold was exceeded only 5% of the time historically, but projections suggest it will be exceeded 50-71% of the time by the end of the century, depending on model. Higher elevations could be more habitable for the owl species. At high-elevation point Y the critical tolerance threshold is projected to be exceeded 0-5% of the time by the end of the century. While there may be locations within the territory that remain cool enough for the owl species, the amount of space will be limited. If we assume that the Spotted Owl species can tolerate a few critically hot days in a summer (say 5% of summer days), then historically 84% of the domain would support the Owl based on these criteria. Projections for the end of the 21st century suggest this space will reduce to 8-32%, depending on model.
Methods:
Skew-normal probability distribution functions were fit to summer (June-August) daily maximum temperature (Tmax) data. The fit was done first for the historical climate period 1961-1990 from observational data and from ten LOCA downscaled CMIP5 models, and then for the end of the 21st Century (2070-2099) projections run under the RCP8.5 “business as usual” greenhouse gas emissions scenario. By this methodology, the full summer temperature probability distribution is represented by only three parameters (location, scale, and shape). The probability of exceeding any thermal tolerance threshold can be determined from these three parameters. For this analysis, we use 35.2˚C as the thermal tolerance threshold for the California Spotted Owl.
Available data:
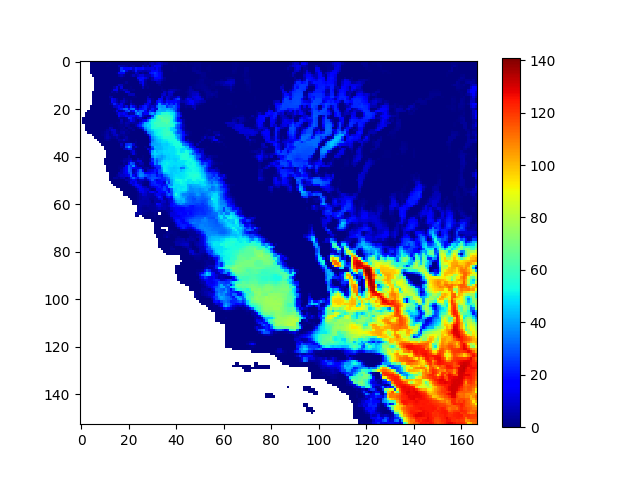
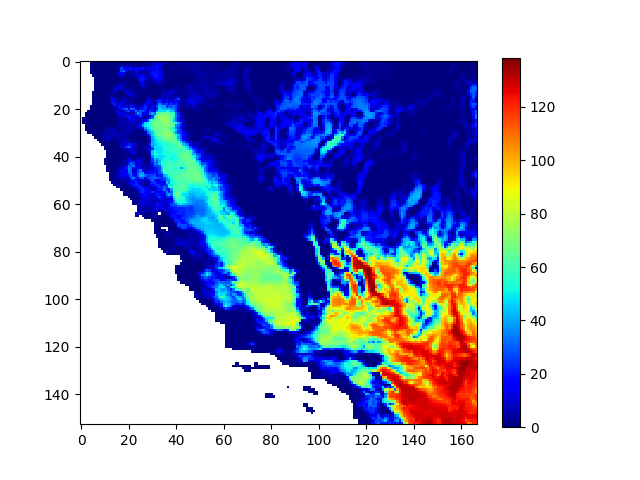
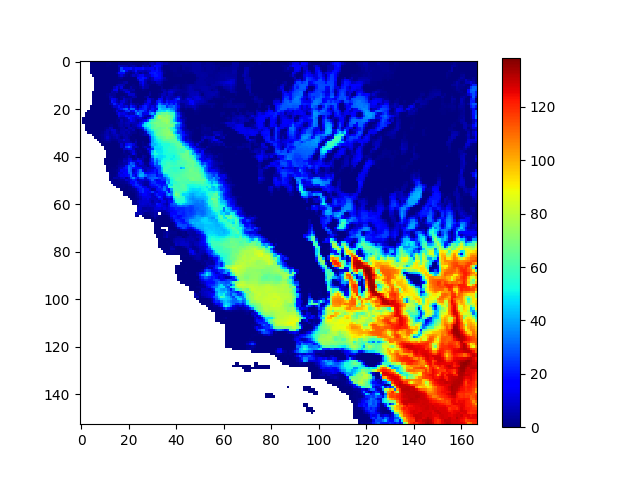
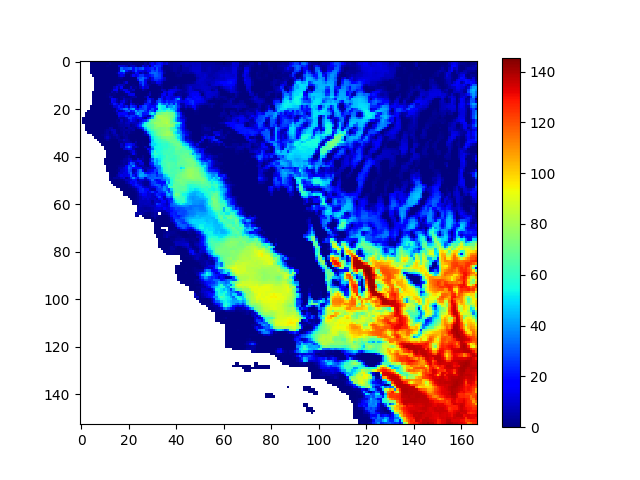
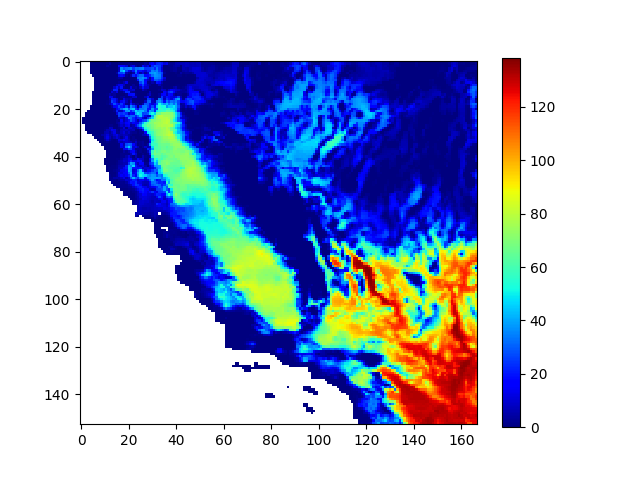
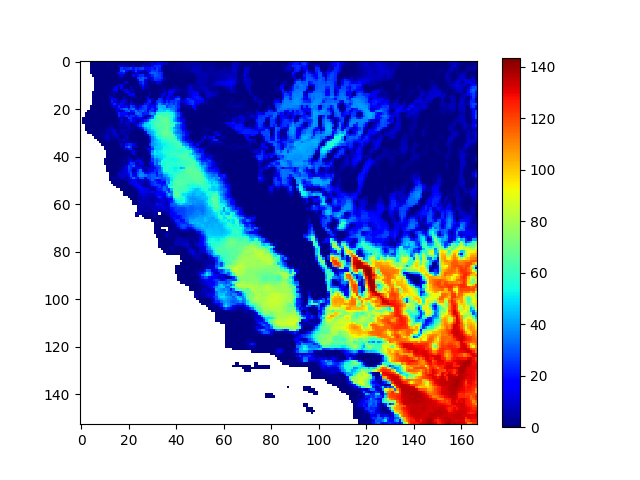
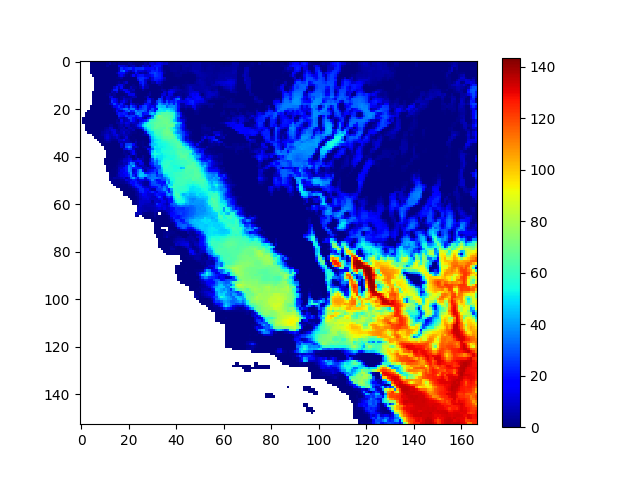
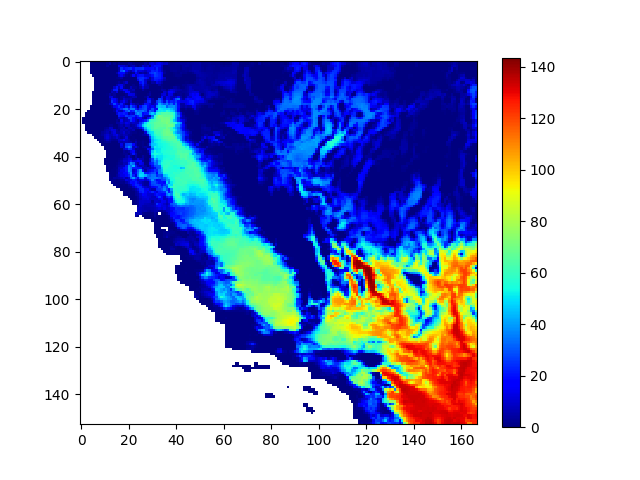
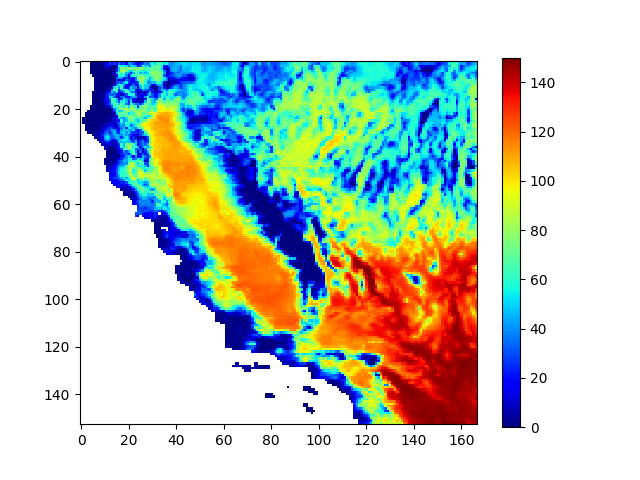
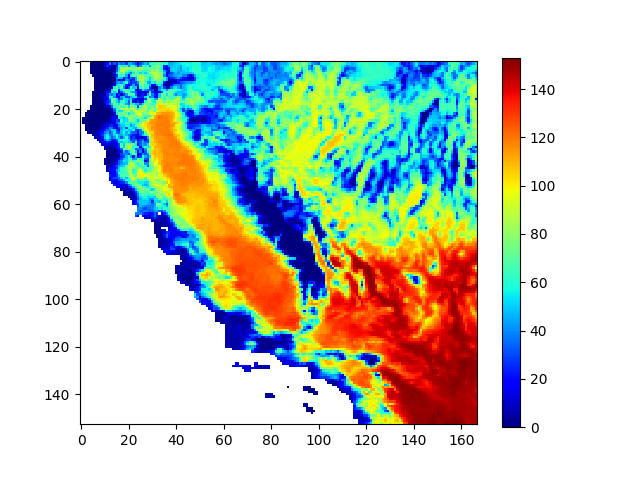
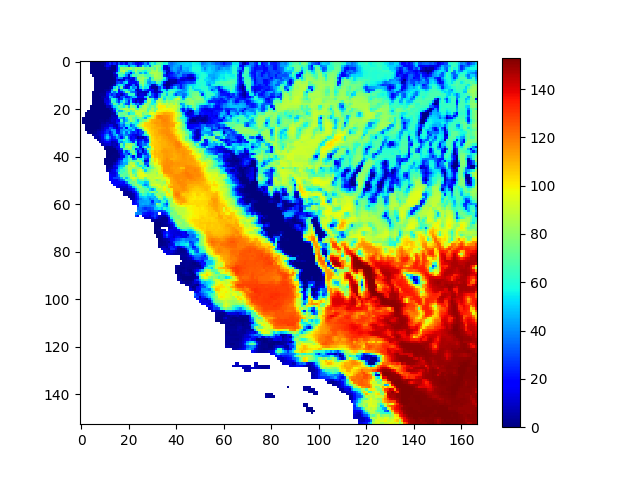
- Threshold exceedances May - September, 1985 - 2025
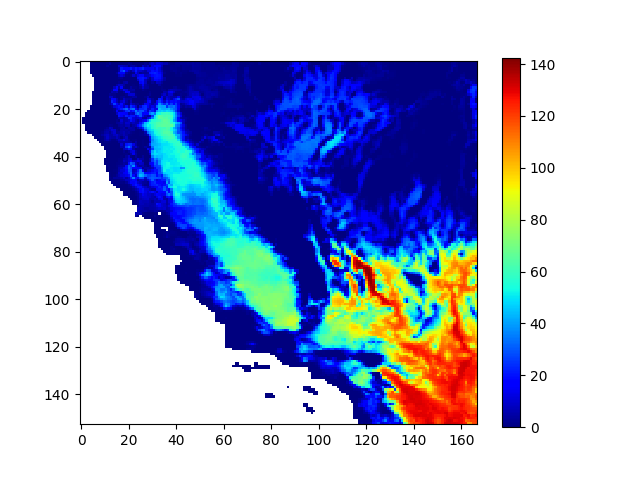
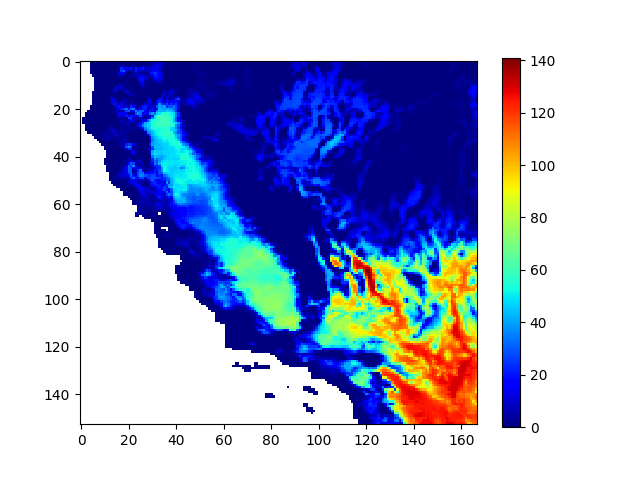
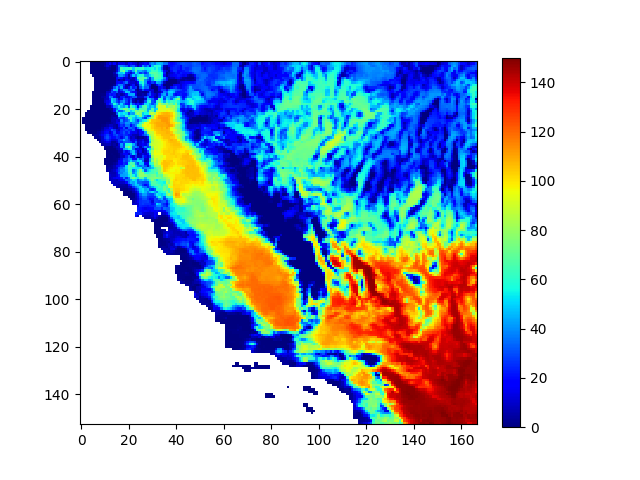
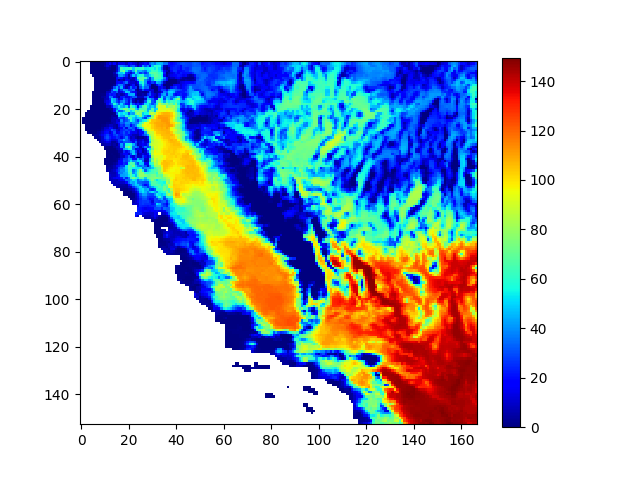
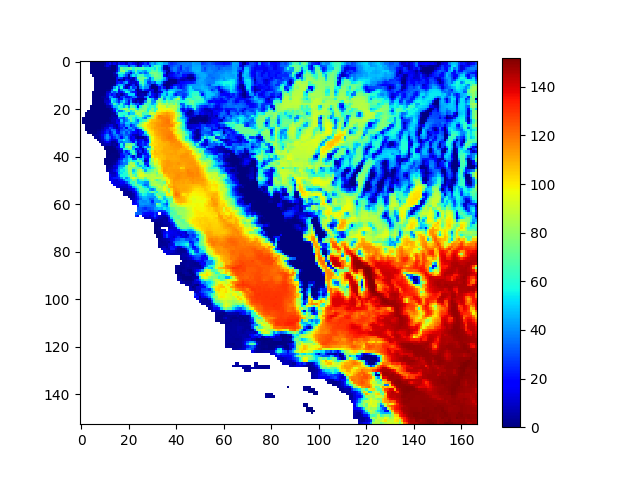
Number of days exceeding 35.2 Degree Celsius
Number of days exceeding 34 Degree Celsius
Number of days exceeding 30 Degree Celsius
Figure 1:
Map showing the complex topography of California and the location of the Central Sierra Spotted Owl habitat.
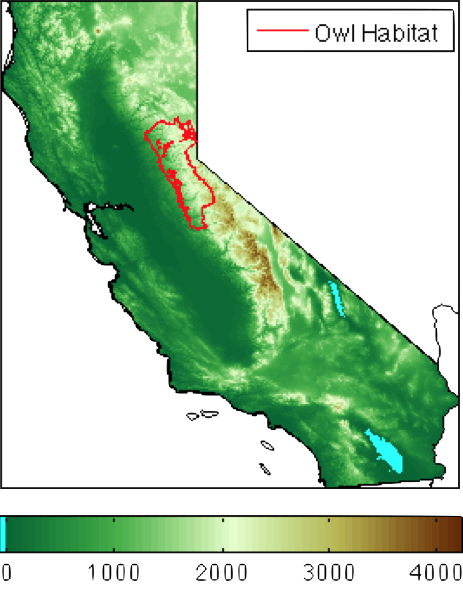
Figure 2:
Panel (a) shows historical (1961-1990) observed summer (JJA) average daily maximum temperatures over the spotted owl territory. Panel (b) shows projected future daily maximum temperatures for the end of the 21st century under RCP8.5. The average change over the territory is 6.9° C. Points X and Y mark the locations of a low elevation point (1052 meters) and a high elevation point (2964 meters), respectively.
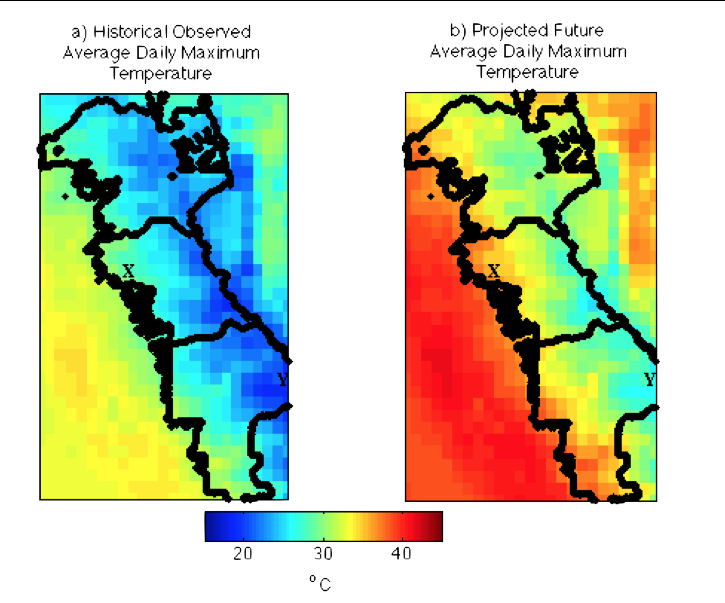
Figure 3:
Tmax PDF for Points X and Y for historical observations (thin black line) and end-of-century projections from ten LOCA downscaled CMIP5 models (thicker colored lines). The sold gray shading highlights temperatures above the thermal tolerance threshold of the California Spotted Owl. The locations of low-elevation point X and high-elevation point Y are shown in Figure 2. At point X, historically the critical threshold was exceeded only about 5% the time while in the future this is projected to increase to 50-71%, depending on model. At point Y, the critical threshold was not exceeded historically and future projections suggest it will be exceeded only 0-5% of the time.
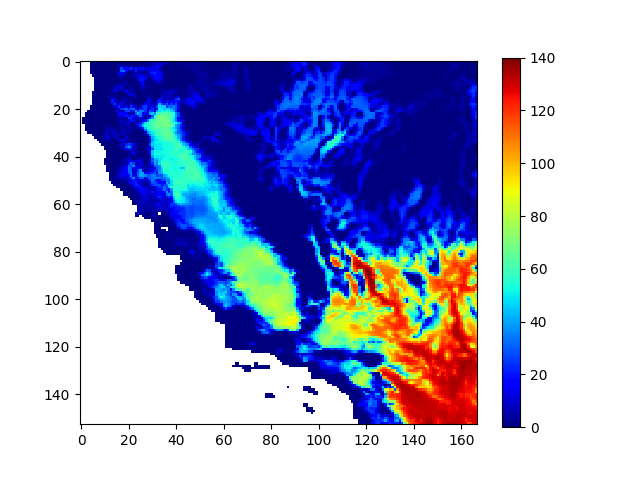
Number of days exceeding 35.2 Degree Celsius, Mar 1 - Sep 30
Year: 1985
Year: 1986
Year: 1987
Year: 1988
Year: 1989
Year: 1990
Year: 1991
Year: 1992
Year: 1993
Year: 1994
Year: 1995
Year: 1996
Year: 1997
Year: 1998
Year: 1999
Year: 2000
Year: 2001
Year: 2002
Year: 2003
Year: 2004
Year: 2005
Year: 2006
Year: 2007
Year: 2008
Year: 2009
Year: 2010
Year: 2011
Year: 2012
Year: 2013
Year: 2014
Year: 2015
Year: 2016
Year: 2017
Year: 2018
Year: 2019
Year: 2020
Year: 2021
Year: 2022
Year: 2023
Year: 2024
Year: 2025
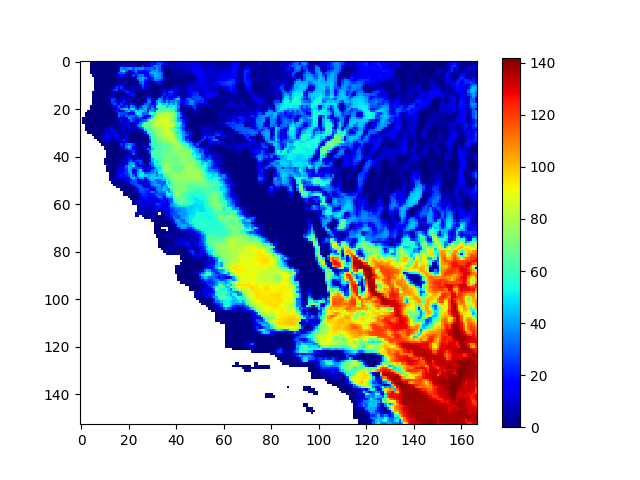
Number of days exceeding 34 Degree Celsius, Mar 1 - Sep 30
Year: 1985
Year: 1986
Year: 1987
Year: 1988
Year: 1989
Year: 1990
Year: 1991
Year: 1992
Year: 1993
Year: 1994
Year: 1995
Year: 1996
Year: 1997
Year: 1998
Year: 1999
Year: 2000
Year: 2001
Year: 2002
Year: 2003
Year: 2004
Year: 2005
Year: 2006
Year: 2007
Year: 2008
Year: 2009
Year: 2010
Year: 2011
Year: 2012
Year: 2013
Year: 2014
Year: 2015
Year: 2016
Year: 2017
Year: 2018
Year: 2019
Year: 2020
Year: 2021
Year: 2022
Year: 2023
Year: 2024
Year: 2025
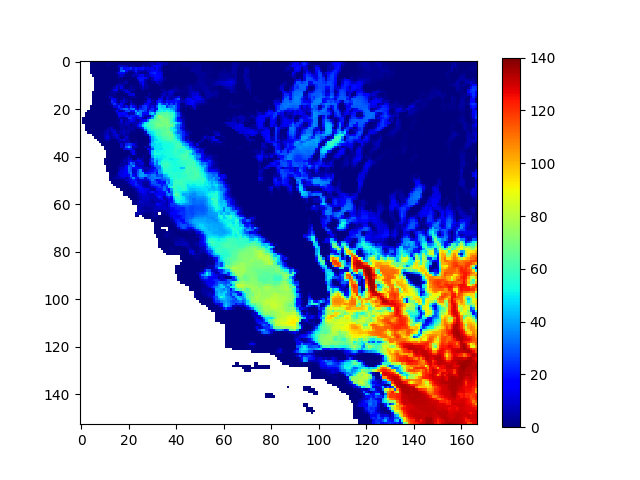
Number of days exceeding 30 Degree Celsius, Mar 1 - Sep 30
Year: 1985
Year: 1986
Year: 1987
Year: 1988
Year: 1989
Year: 1990
Year: 1991
Year: 1992
Year: 1993
Year: 1994
Year: 1995
Year: 1996
Year: 1997
Year: 1998
Year: 1999
Year: 2000
Year: 2001
Year: 2002
Year: 2003
Year: 2004
Year: 2005
Year: 2006
Year: 2007
Year: 2008
Year: 2009
Year: 2010
Year: 2011
Year: 2012
Year: 2013
Year: 2014
Year: 2015
Year: 2016
Year: 2017
Year: 2018
Year: 2019
Year: 2020
Year: 2021
Year: 2022
Year: 2023
Year: 2024
Year: 2025
Localized Constructed Analogs (LOCA) FAQs
Introduction
Climate is an emergent product of Earth’s orbit, volcanic activity, atmospheric gases, and energy transfers among air, water, and land. Climate models include equations that represent the physical drivers of climate sufficiently to make useful statistical predictions at global extents and over long time periods. Solving the equations requires substantial amounts of observed or modeled data.
Read more (Primer on climate data and global climate models).
The 10 downscaled climate models that area available on SCENIC were chosen following a three step screening process.- Evaluation of the Global Climate Models at global scale
- Evaluation of the Global Climate Models over teh Western United States
- Evaluation of the Global Climate Models for the specific needs of the California Department of Water Resources
LOCA Home Page
CCTAG Report.
Climate Change Technical Advisory Group (CCTAG) Home Page
Data Access
Case studies for natural resource management
Heatwaves Investigating changes in heatwave probabilities under a warming climate
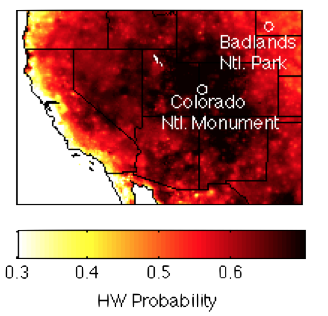 |
Changes in heat wave probability do not directly follow changes in background warming. Background warming in the Southwest is greatest in the northern part of the domain, however, the largest increases in heat wave probability occurs in the central part of the domain. Read more |
Temperature Extremes
Thermal tolerance of wildlife species

|
Identifying where on a landscape temperature extremes are exceeded now and where they may be exceeded in the future could help prioritize where to manage for different species. Read more |
